Mantle Price Forecast: MNT bulls face uphill battle as retail interest wobbles
- Mantle extends recovery for the second day, approaching a key resistance trendline.
- Derivatives data flash mixed signals as futures Open Interest declines, but funding rates shift positive.
- The technical outlook remains mixed as momentum indicators suggest a potential bullish shift.

Mantle (MNT) edges higher by over 2% at press time on Thursday, building on the gains from the previous day. The short-term recovery approaches a key resistance trendline, with bulls aiming for a potential breakout rally. However, the lack of confidence in derivatives traders reflects the risk-averse sentiment in the market, making the recovery an uphill battle.
Sentiments shift in Mantle derivatives
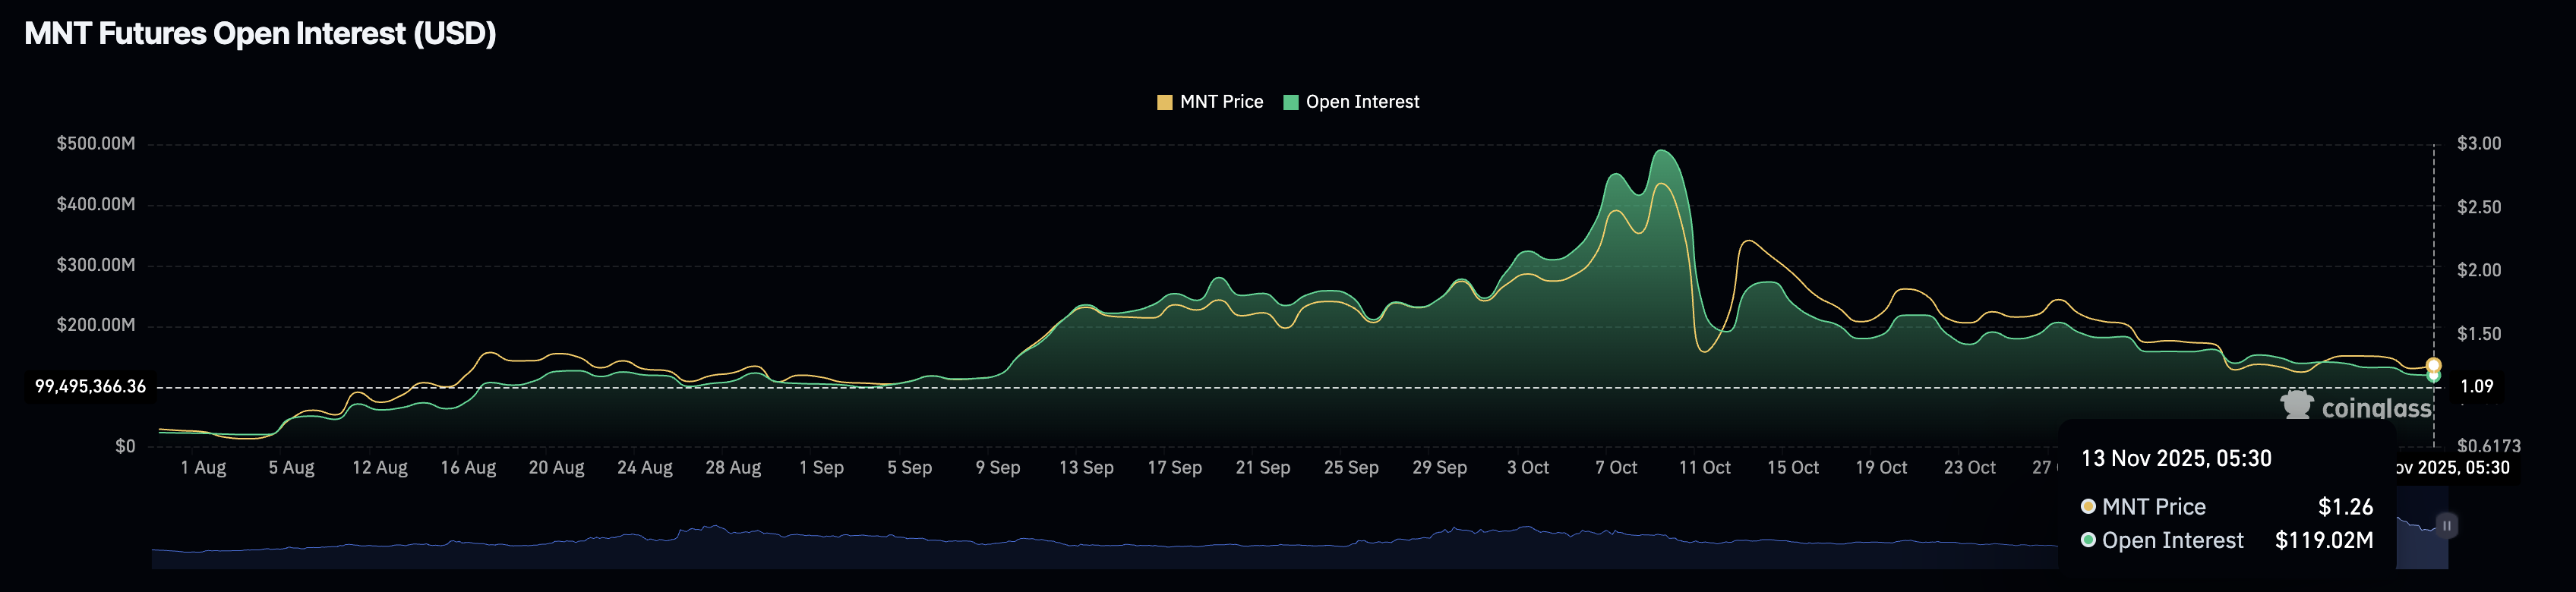
Mantle struggles to sustain the demand of derivatives traders as the rising volatility in the broader cryptocurrency market spreads a risk-averse sentiment. According to CoinGlass, the MNT Open Interest (OI), which tracks the notional value of all outstanding futures contracts, is decreasing after the October 10 crash, indicating that traders lack confidence in Mantle’s short-term recovery.
At the time of writing, the MNT futures OI stands at $119.02 million on Thursday, down from $158.26 million on November 1.
Despite the prevailing risk-off sentiment, the OI-weighted funding rate is at 0.0099%, up from -0.0009% earlier in the day. This indicates a short-term increase in traders' risk appetite, as they are willing to pay a premium for holding long positions.
Mantle recovery eyes further gains with trendline breakout rally
Mantle’s short-term recovery gains traction despite low retail support, approaching a critical resistance trendline on the 4-hour chart formed by connecting the highs of October 12 and 27, near $1.3200. Furthermore, MNT trades below the crucial 50-period, 100-period, and 200-period Exponential Moving Averages (EMAs), which maintain a downward slope indicating a strong bearish trend.
If MNT successfully clears the resistance trendline, the 100-period and 200-period EMAs near $1.3808 and the $1.5000 psychological mark, respectively, could serve as overhead targets.
The technical indicators on the 4-hour chart corroborate the breakout potential, as the Moving Average Convergence Divergence (MACD) rises to converge with the signal line, hinting at a potential crossover. If the blue line crosses above the red, it could confirm a fresh bullish trend momentum.
At the same time, the Relative Strength Index (RSI) rises to 50 on the same chart, indicating that the buying and selling pressure are neck and neck. If RSI exceeds this midline, it would signal a buy-side dominance.
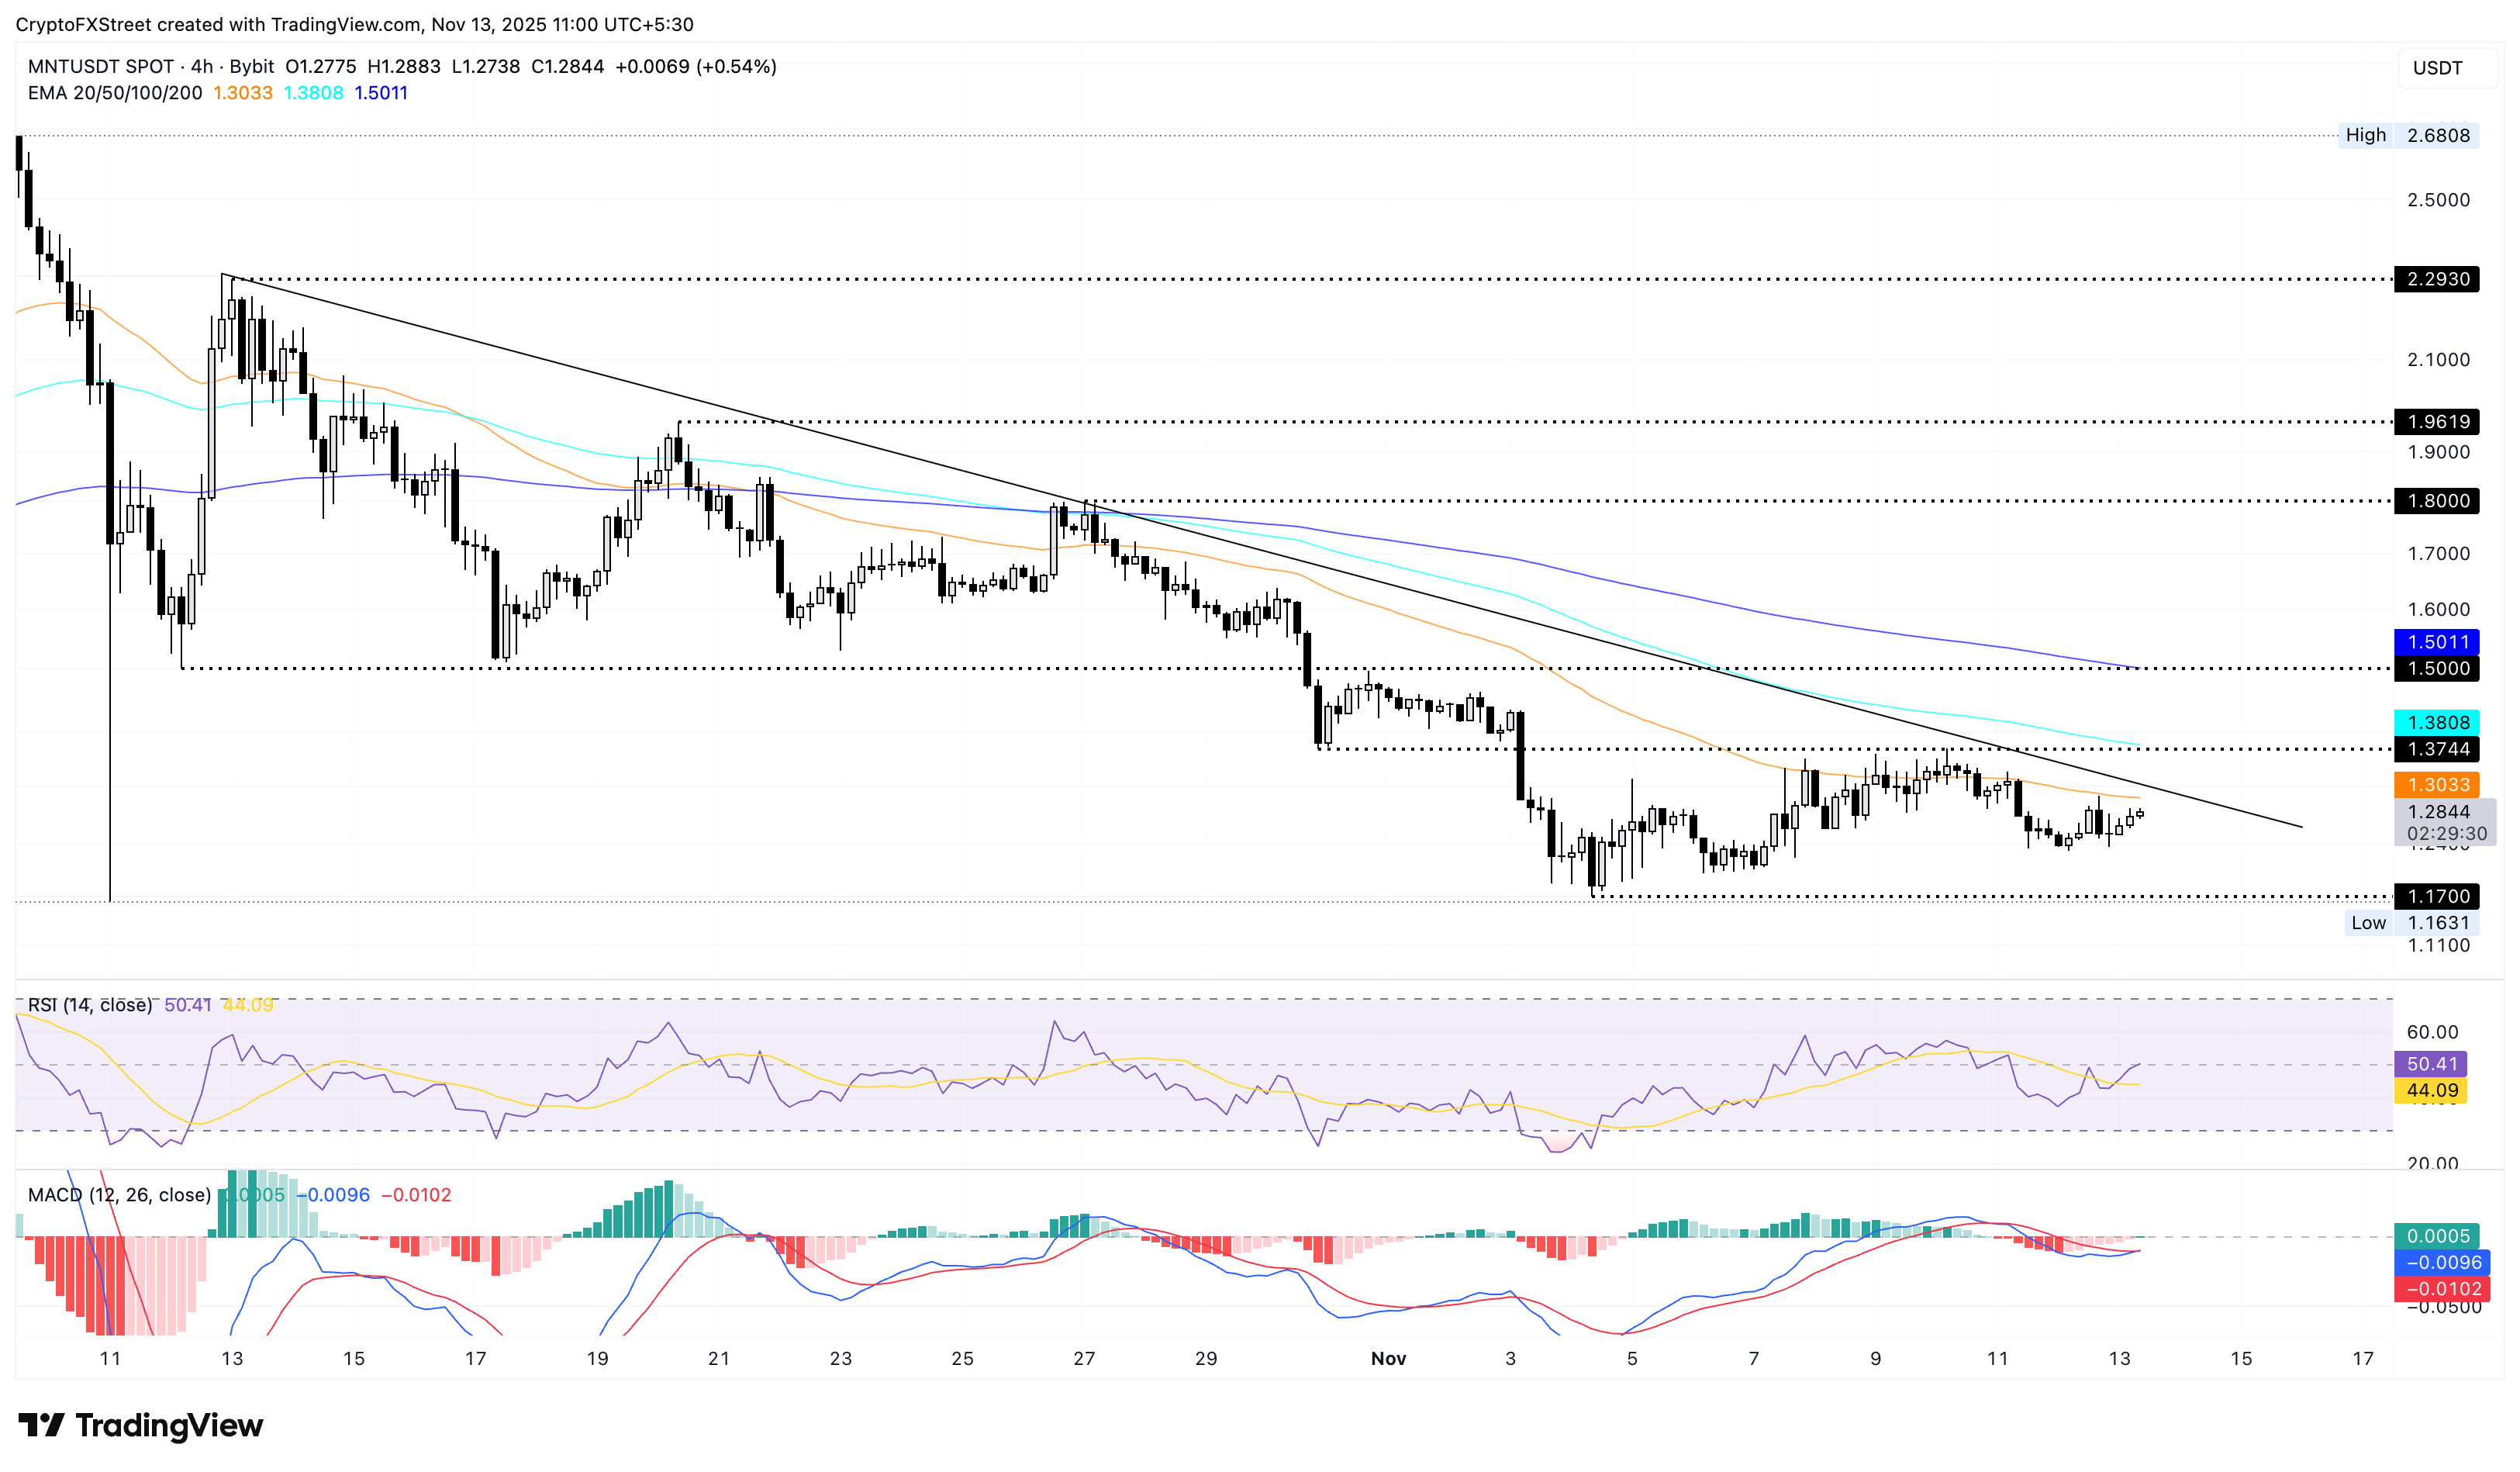
Looking down, if Mantle recovery turns south, it risks a pullback to the $1.1631 low from October 10.
Author

Vishal Dixit
FXStreet
Vishal Dixit holds a B.Sc. in Chemistry from Wilson College but found his true calling in the world of crypto.



