- Litecoin bucks the crypto trend to trade higher today, LTC/USD is up 1.69%.
- The price was halted by a intraday trendline which matched a resistance level.
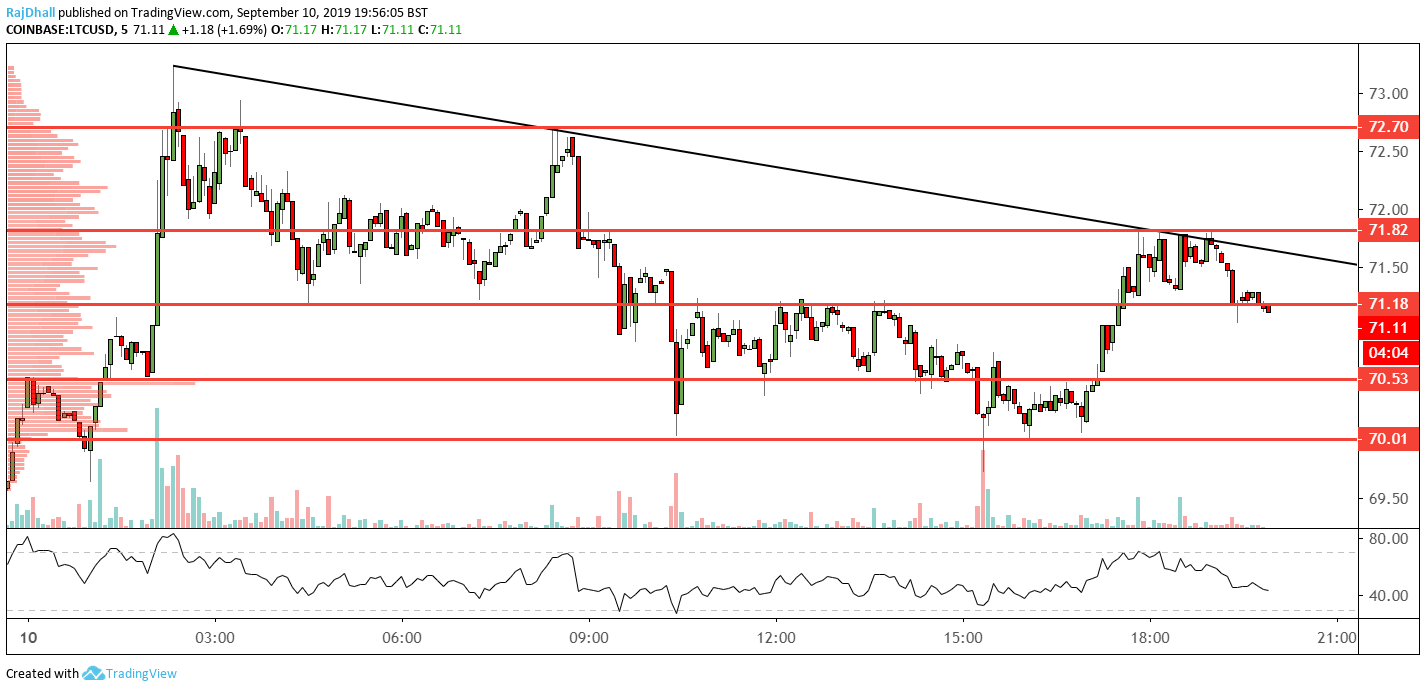
LTC/USD had a move higher but the progress was stopped by an intraday trendline.
Now it looks like the price is heading to support level near the 70 mark, with the next one at 70.53.
Interestingly the RSI is giving a slightly different signal. It looks like a failure swing or hidden divergence is setting up for a move higher.
This is when the price makes a higher low but the indicator breaks lower into an oversold position.
It does seem like momentum is with the bears but if price breaks above 71.18 again we could make another run for the trendline.
The volume at price indicator on the left hand side is showing a big amount of volume at 70.50 so keep an eye on price action at that level.
The main thing is on the daily chart price is still in the back and positive for the session. Lets see if it can stay that way.
All information and content on this website, from this website or from FX daily ltd. should be viewed as educational only. Although the author, FX daily ltd. and its contributors believe the information and contents to be accurate, we neither guarantee their accuracy nor assume any liability for errors. The concepts and methods introduced should be used to stimulate intelligent trading decisions. Any mention of profits should be considered hypothetical and may not reflect slippage, liquidity and fees in live trading. Unless otherwise stated, all illustrations are made with the benefit of hindsight. There is risk of loss as well as profit in trading. It should not be presumed that the methods presented on this website or from material obtained from this website in any manner will be profitable or that they will not result in losses. Past performance is not a guarantee of future results. It is the responsibility of each trader to determine their own financial suitability. FX daily ltd. cannot be held responsible for any direct or indirect loss incurred by applying any of the information obtained here. Futures, forex, equities and options trading contains substantial risk, is not for every trader, and only risk capital should be used. Any form of trading, including forex, options, hedging and spreads, contains risk. Past performance is not indicative of future FX daily ltd. are not Registered Financial Investment Advisors, securities brokers-dealers or brokers of the U.S. Securities and Exchange Commission or with any state securities regulatory authority OR UK FCA. We recommend consulting with a registered investment advisor, broker-dealer, and/or financial advisor. If you choose to invest, with or without seeking advice, then any consequences resulting from your investments are your sole responsibility FX daily ltd. does not assume responsibility for any profits or losses in any stocks, options, futures or trading strategy mentioned on the website, newsletter, online trading room or trading classes. All information should be taken as educational purposes only.
Recommended Content
Editors’ Picks
Ripple's move above this key level could trigger nearly 50% rally for XRP
Ripple has overcome a critical resistance level and flipped into a support floor on the weekly time frame. This development happened while XRP tightly consolidated for roughly 250 days. Investors can expect XRP to kickstart a massive rally.
Optimism price outlook with nearly $90 million worth of OP tokens flooding markets on Friday
Optimism volatility has shrunk in the ours leading to the network’s cliff unlock. It joins the likes of dYdX and Sui, which have similar events on their calendars. As token unlocks are often considered bearish catalysts, investors should brace for a reaction after the event.
Top 3 Price Prediction Bitcoin, Ethereum, Ripple: Retail watches from the sidelines with a bias for shorts
Bitcoin could clear $73,777 peak as BTC bulls resurface. Ethereum might fall 10% before next leg up as ETH RSI teases with sell signal. XRP could lose $0.6000 threshold as Ripple bulls fail to show up.
Jito price could hit $6 as JTO coils up inside this bullish pattern
Jito price action shows a potential cup and handle formation. Based on theoretical measurement rules, a successful breakout could yield a 56% rally to $6.0. A breakdown of the $3.86 support level would create a lower low for JTO and invalidate the bullish thesis.
Bitcoin: BTC may have recovered, but is it out of the woods?
Bitcoin’s (BTC) upward momentum has shown a significant decline for the past two weeks or so. This development led to a bearish signal on the weekly and an uncertain outlook on the monthly.