LTC/USD technical analysis: Potential breakout scenario on the 4-hour chart

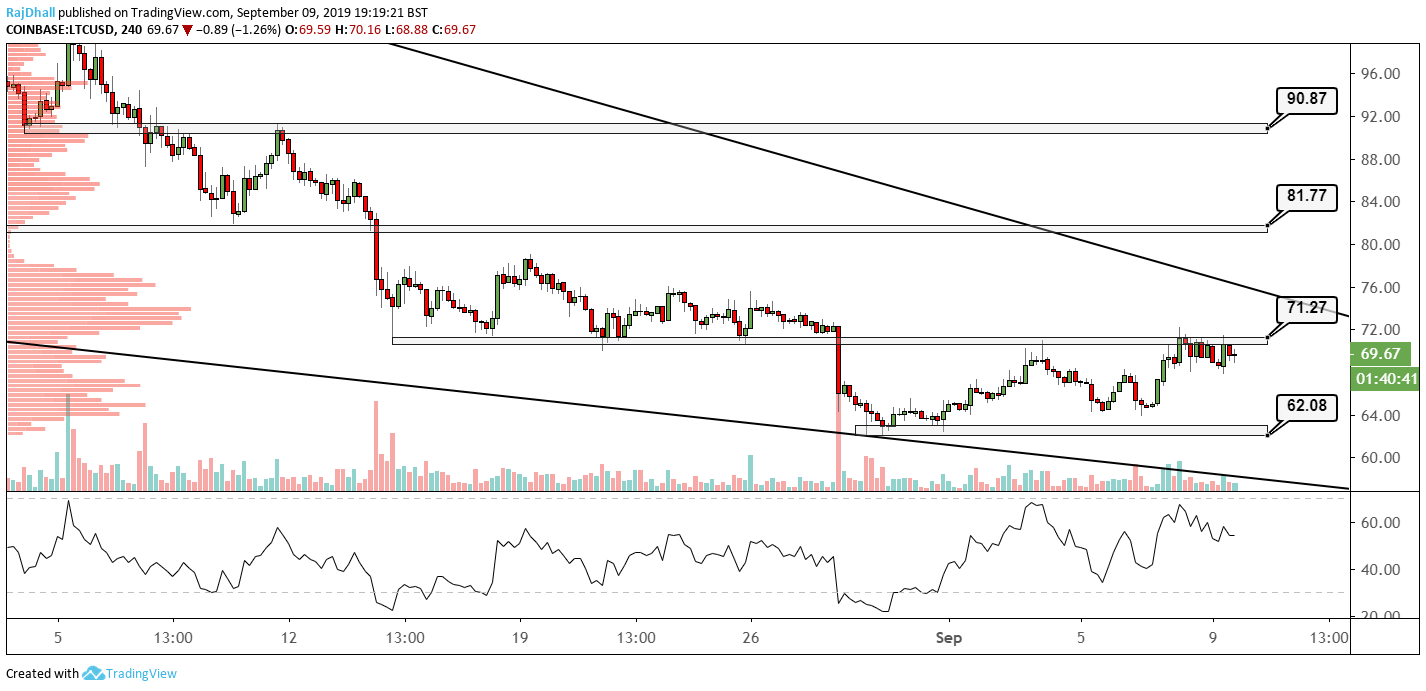
After the bear phase from 140 down to 60 the price has now made a lower high and a lower low on the 4-hour chart.
This is significant as the bear market was so fierce. The RSI indicator has also pushed higher but price consolidating and needs a firm break of 70.
The resistance level at 71.27 is holding firm for now and if we do see a sustained break watch to see if it on big volume.
On the downside 62 is the main support and a break under that support would mean the downtrend is back in tack.
74.12 is the main value area on the chart. This is the price where most contracts changed hand and is also known as the value area.
This chart is indicating the LTC/USD pair could move higher but as long as that resistance is broken.
Author

Rajan Dhall, MSTA
FX Daily
Rajan Dhall is an experienced market analyst, who has been trading professionally since 2007 managing various funds producing exceptional returns.


