LTC/USD technical analysis: Bulls possibly targeting $52 resistance line
- LTC/USD bulls have pulled the price up 25% this Friday.
- Bulls may possibly test the $52 resistance line if upwards momentum is sustained.

LTC/USD has had a great day this Friday as its price jumped by 25% based on market speculation. This made Litecoin the biggest mover among the top 10 cryptocurrencies list. Technical analysis shows that if the momentum is sustained, the market can possibly break resistance at $52.
LTC/USD daily chart
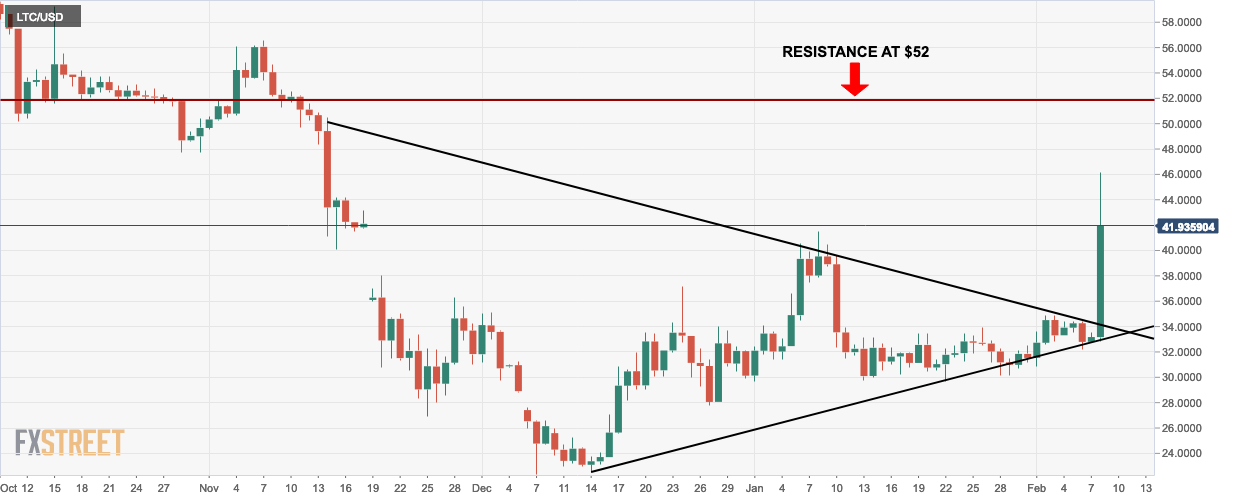
- The market sees a bullish breakout from the triangle formation.
- If upward momentum is sustained, LTC/USD can break resistance at $52.
LTC/USD 4-hour chart
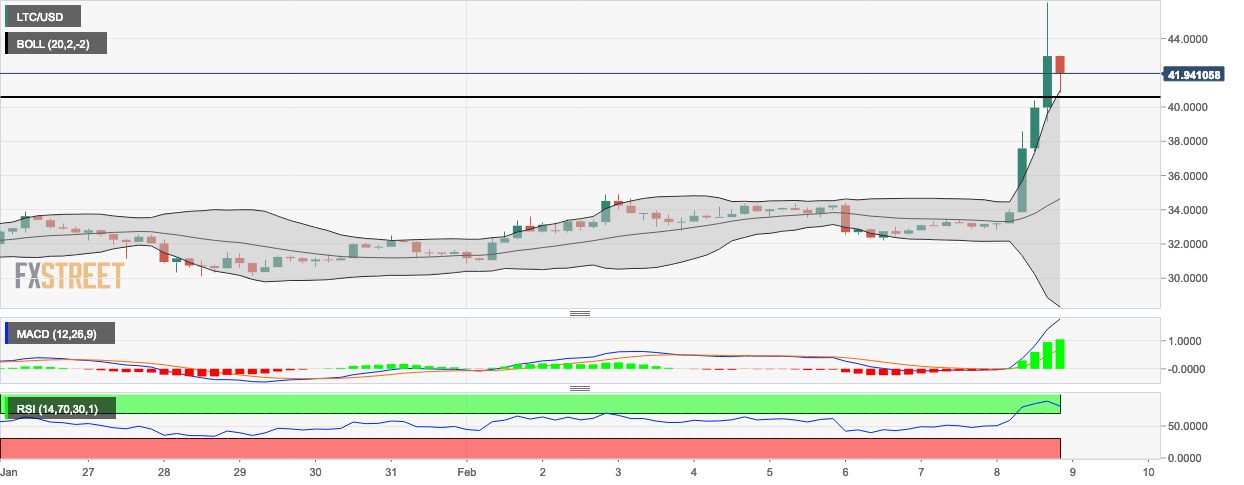
- Relative strength index has ventured into the overbought zone, reflecting the bullish market.
- Both the 20-day Bollinger band and the moving average convergence/divergence (MACD) reflects the bullishness and volatility of the market.
LTC/USD hourly chart
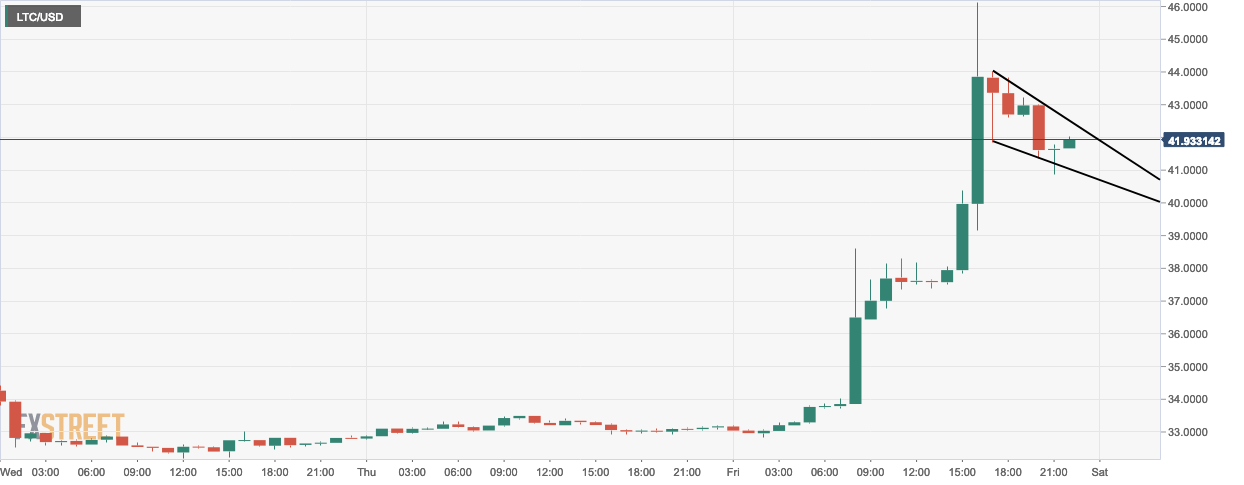
- Descending wedge pattern shows the market’s attempt at consolidation. Another bullish breakout may be on the horizon, post-consolidation.
Author

Rajarshi Mitra
Independent Analyst
Rajarshi entered the blockchain space in 2016. He is a blockchain researcher who has worked for Blockgeeks and has done research work for several ICOs. He gets regularly invited to give talks on the blockchain technology and cryptocurrencies.
More from Rajarshi Mitra


