|

LTC/USD – June 2022 cycle against cycle in US Dollar Index

One of the well known facts of the market are correlations between instruments. However that rule does not apply every time in every instrument. Here at Elliott Wave Forecast we call a first degree correlation when 2 instruments move in accordance to their correlated nature. The opposite is called second dimension correlation. It occurs when the 2 correlated instruments do not move tick by tick the same and deviate the rule of first degree correlation. In this article we will overlay LTCUSD and USDX to see how a second dimension has been unfolding since cycle from 06.14.22.

Firstly, let’s have a look at Litecoin cycle from 06.14.22.

LTC/USD – Daily chart – Cycle from 06.14.22

LTCUSD

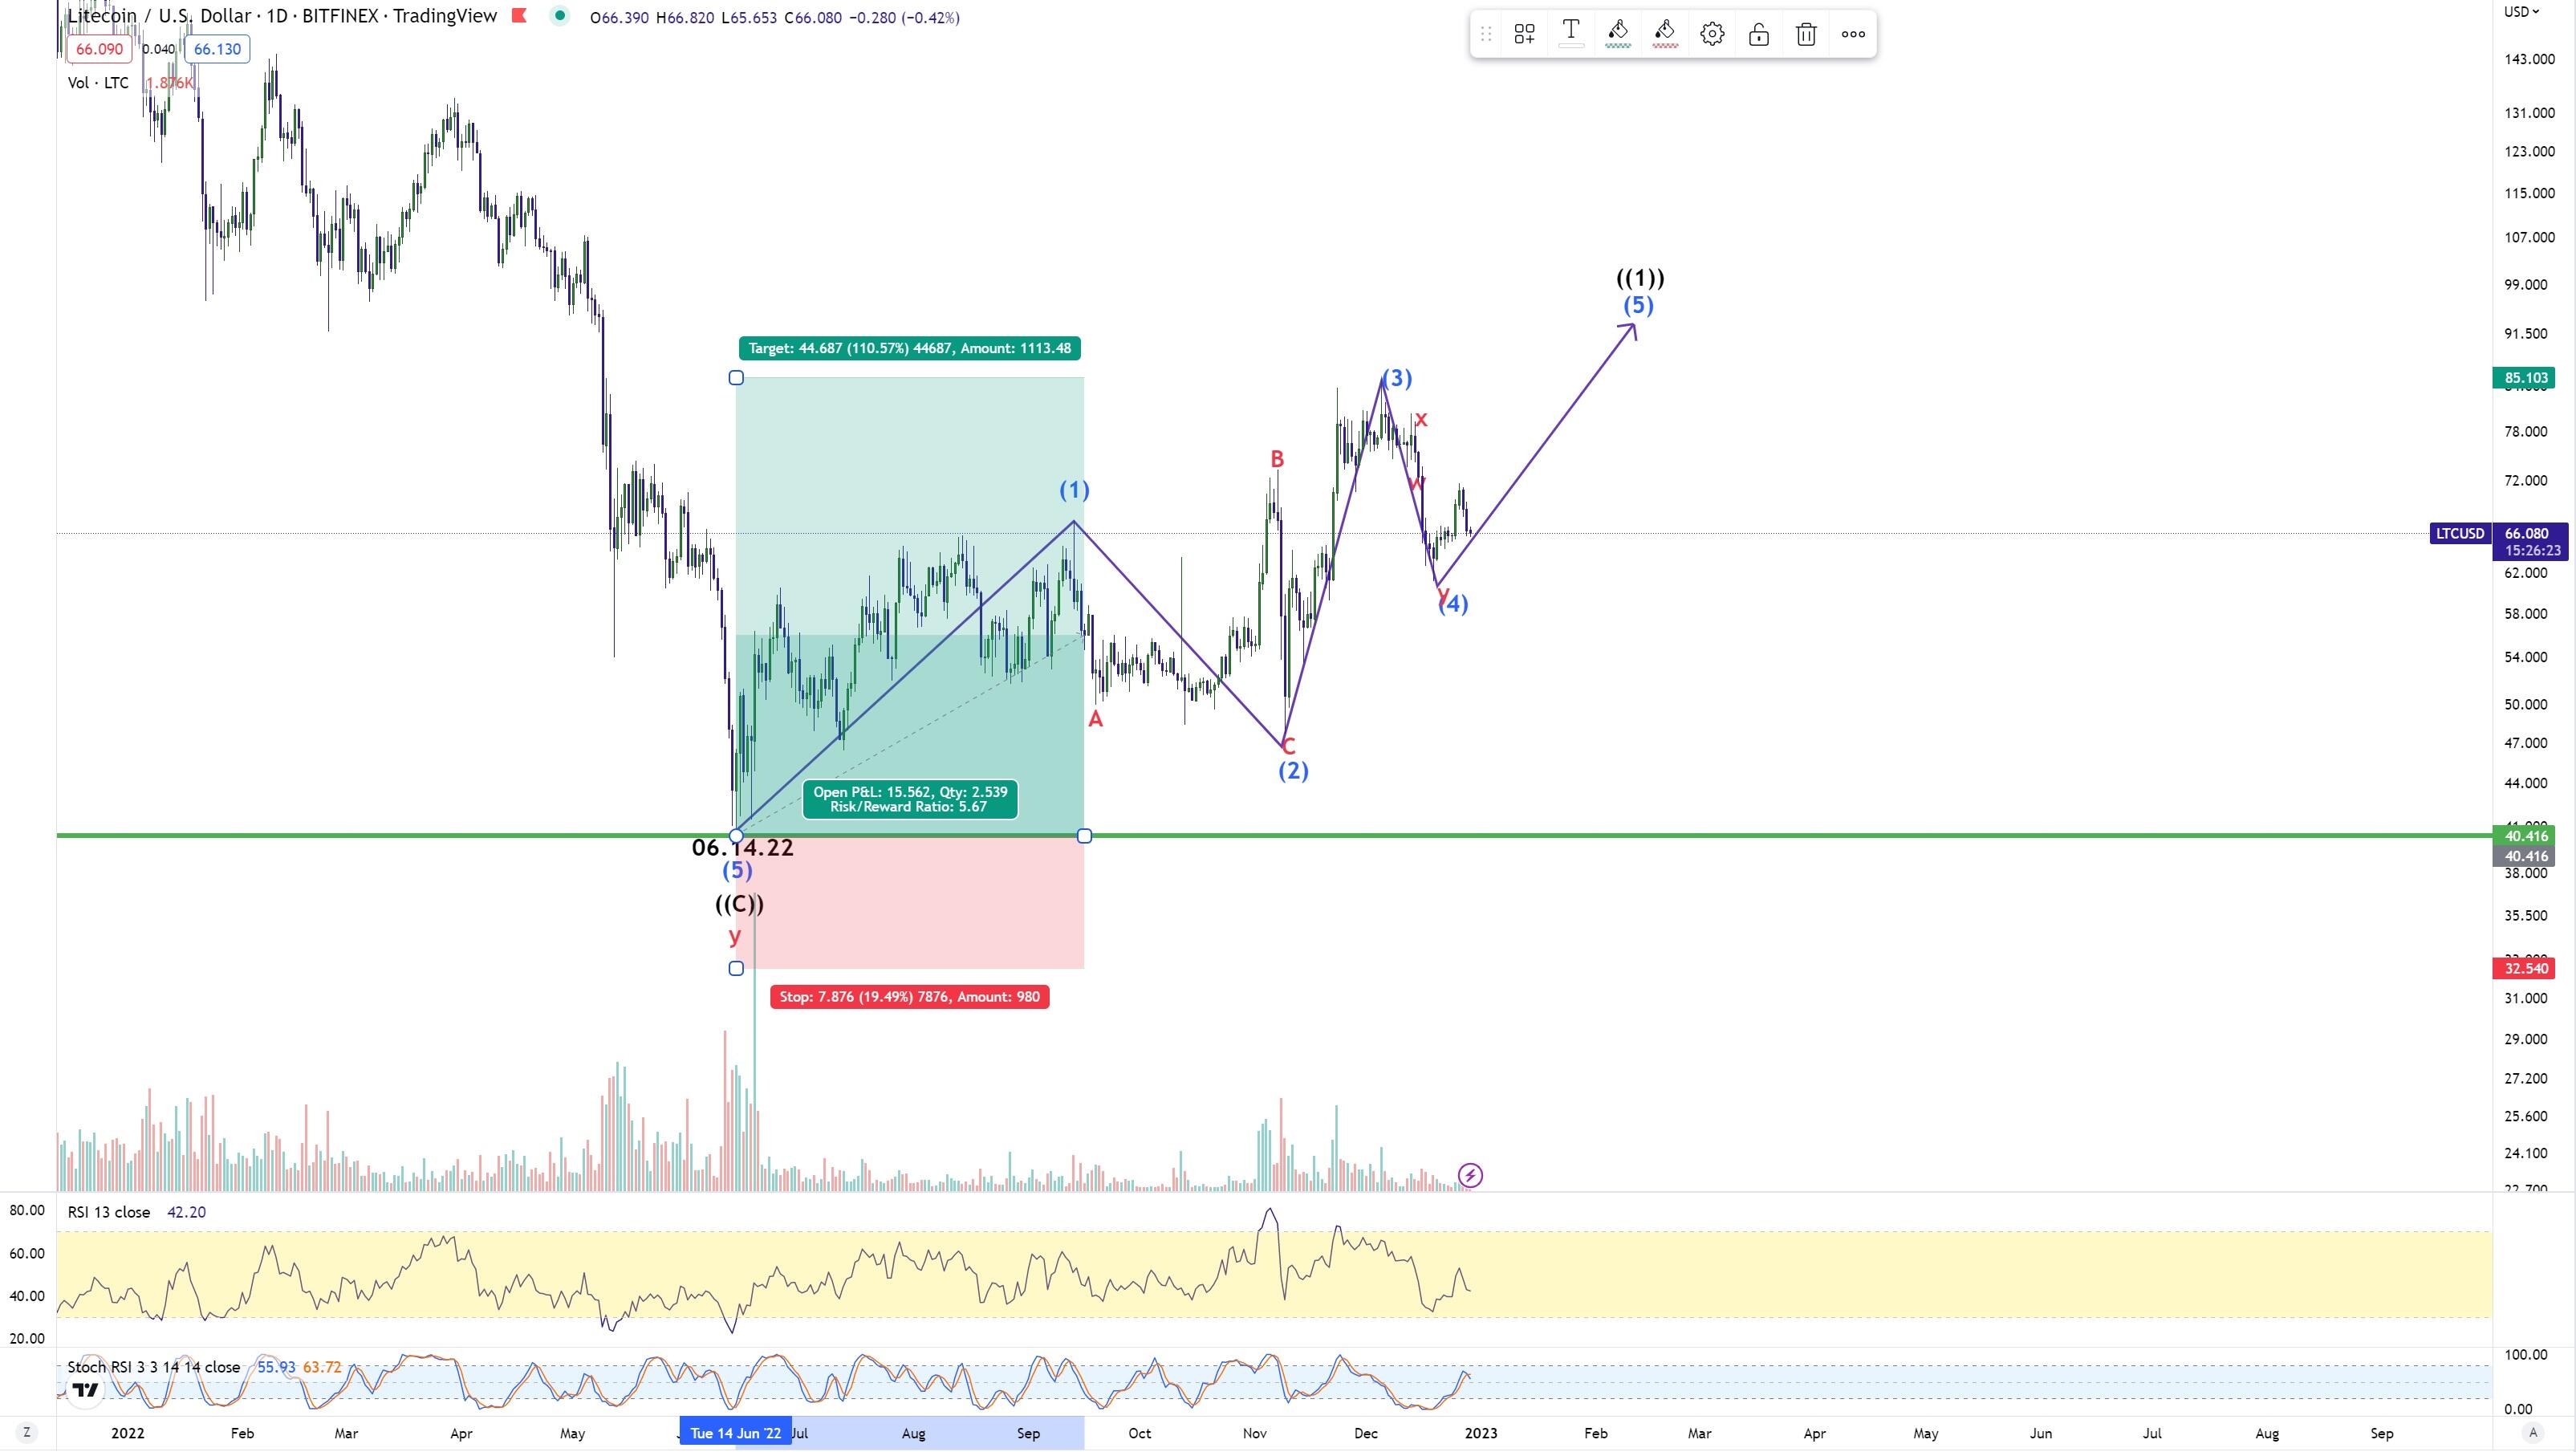
We can see that Litecoin started a new cycle since 06.14.22. So far it looks to be within 5 waves. Currently wave (4) pivot is holding and we can potentially see one more leg higher to end larger degree wave ((1)) towards 90 – 100 area. Also from 06.14.22 until it ended wave (3) has moved up by about 110%.
Most traders after seeing the move would automatically assume that the USDX would have moved inverse to the move in LTCUSD. Well let’s have a look at the USDX next.

US Dollar Index – Daily chart within cycle from 09.28.22

Chart

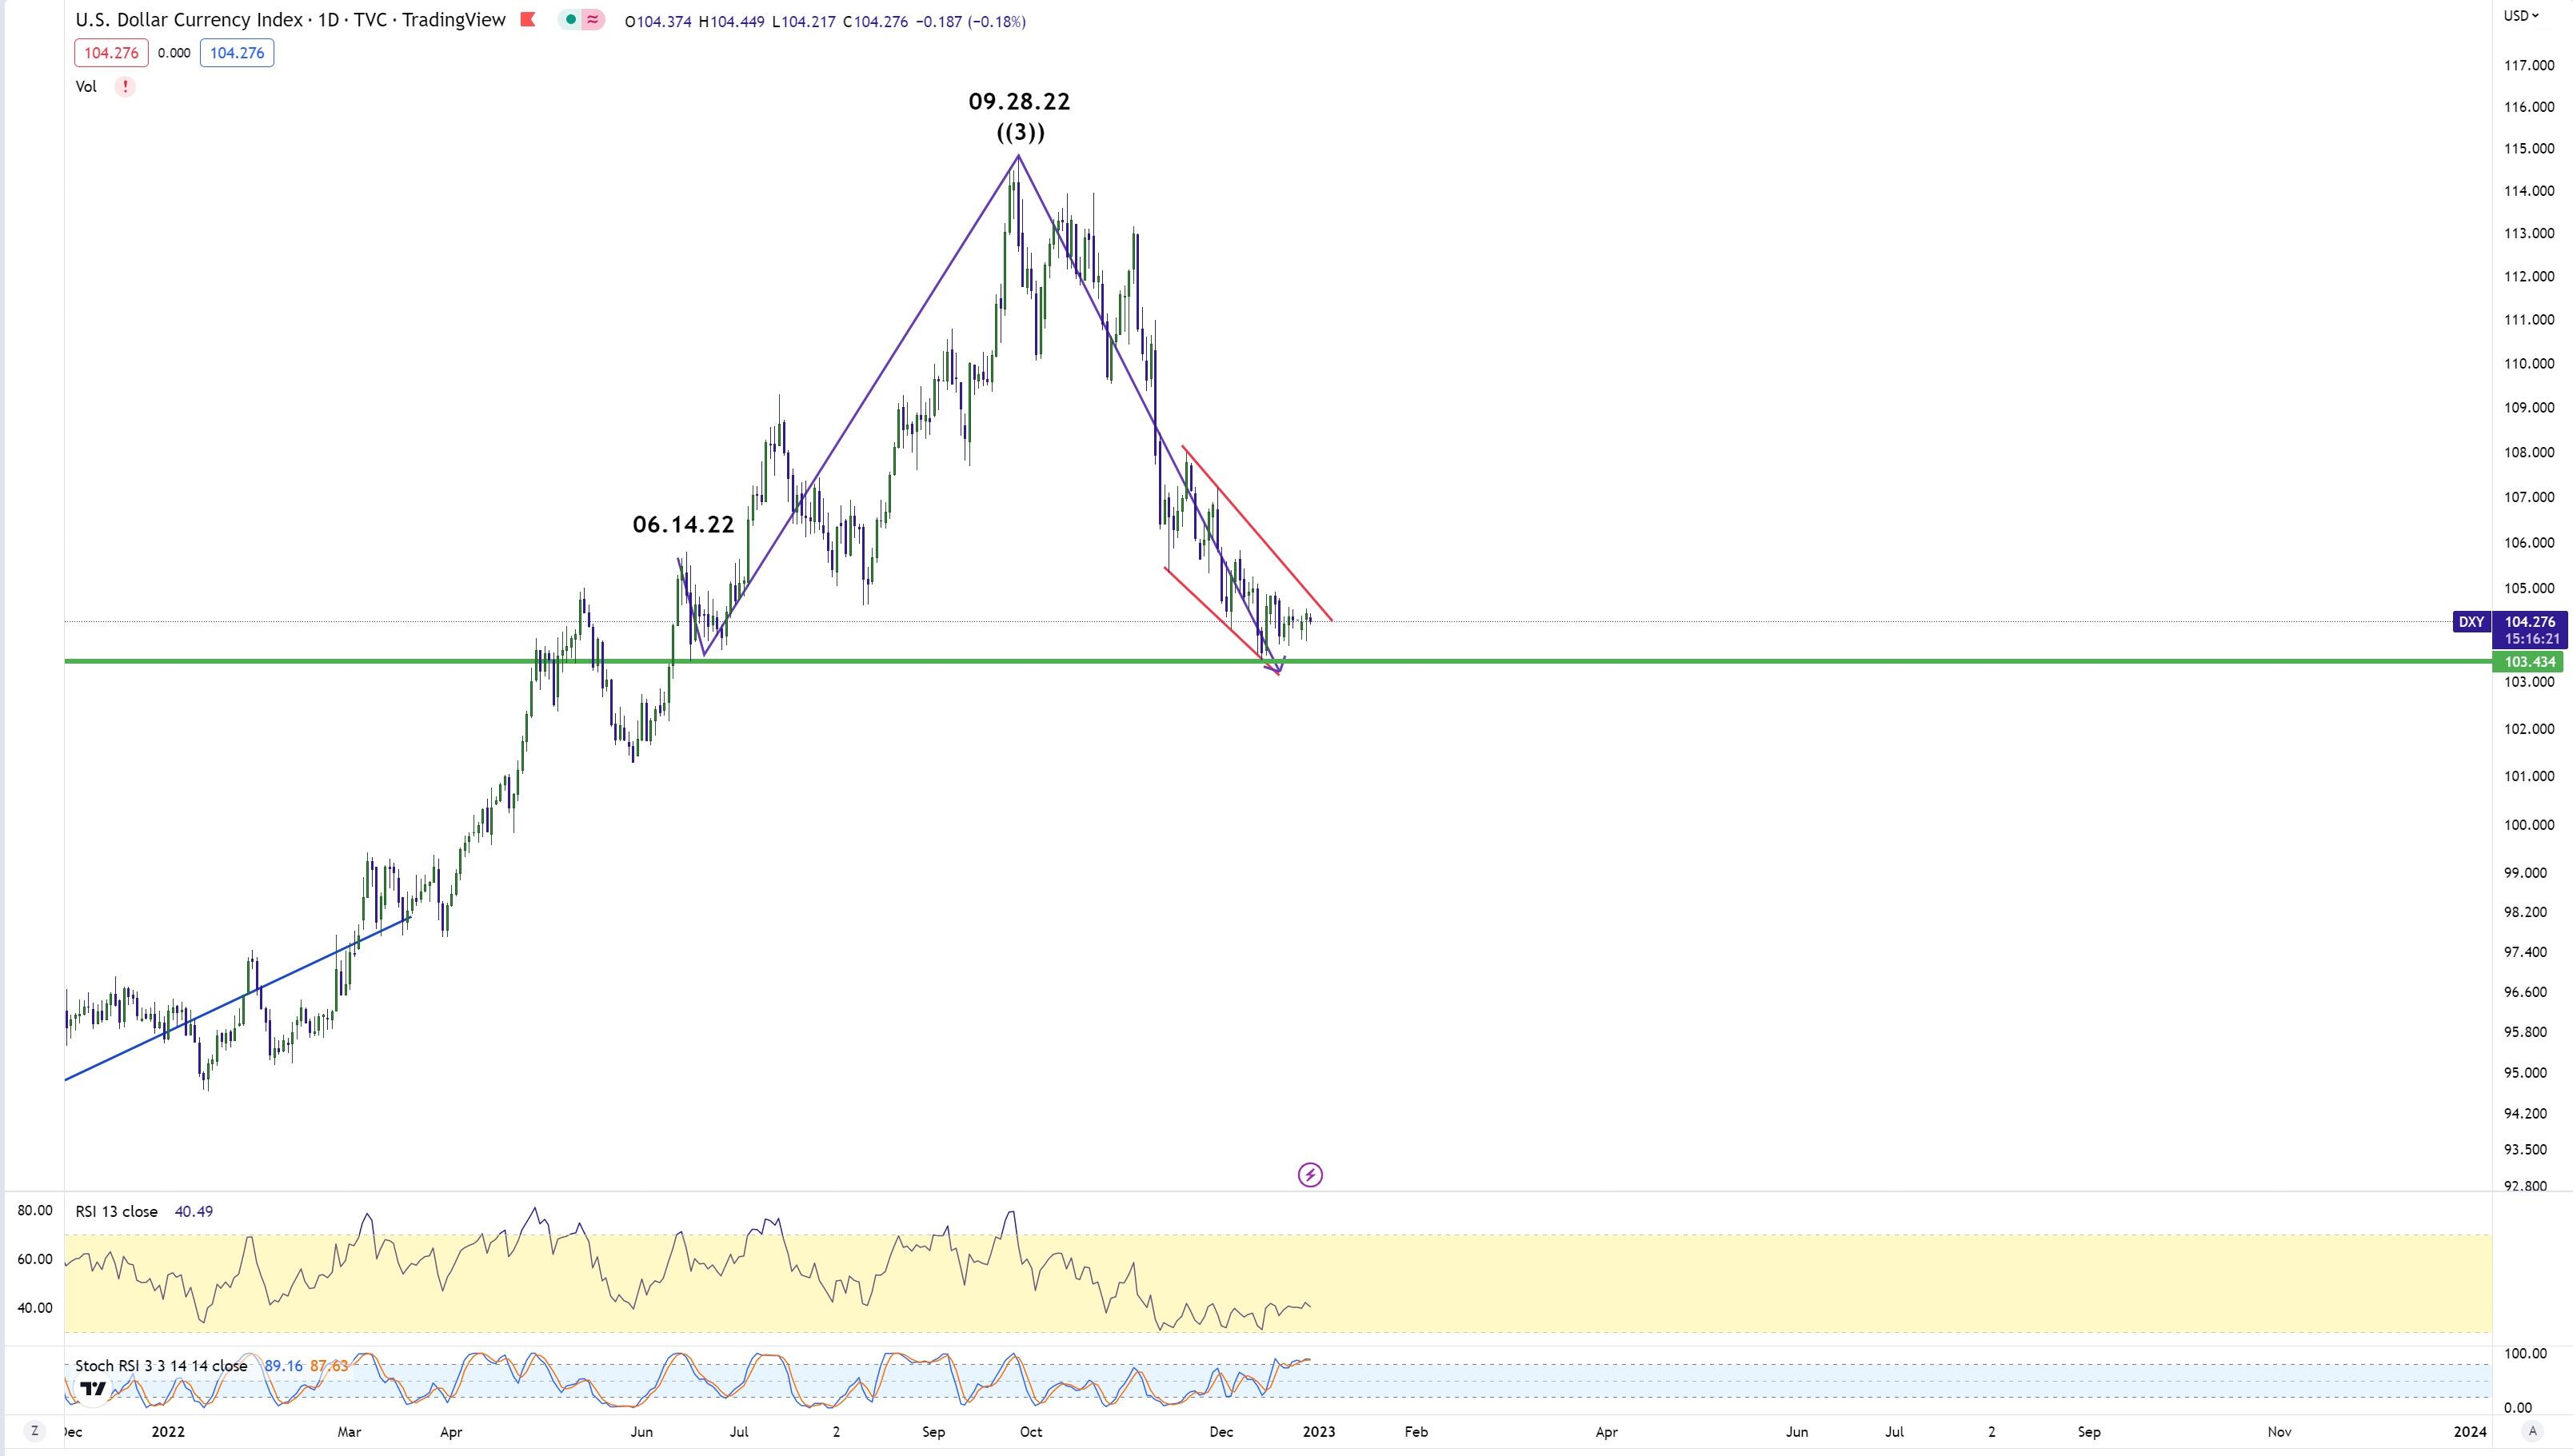
The USDX is at the same level since 06.14.22 when Litecoin started its cycle. The 2 instruments have separated themselves from first degree correlation to second. Wave ((3)) cycle in USDX ended 09.28.22. In Litecoin as of today’s data larger degree cycle ended on 06.14.22.

Author

Elliott Wave Forecast Team

Elliott Wave Forecast Team

ElliottWave-Forecast.com

More from Elliott Wave Forecast Team
Share:

Editor's Picks

Ripple bulls defend key support amid waning retail demand and ETF inflows

XRP ticks up above $1.40 support, but waning retail demand suggests caution. XRP attracts $4 million in spot ETF inflows on Thursday, signaling renewed institutional investor interest.

Crypto Today: Bitcoin, Ethereum, XRP rebound as risk appetite improves

Bitcoin rises marginally, nearing the immediate resistance of $68,000 at the time of writing on Friday. Major altcoins, including Ethereum and Ripple, hold key support levels as bulls aim to maintain marginal intraday gains.

Bitcoin Weekly Forecast: No recovery in sight 

Bitcoin price continues to trade sideways between $65,729 and $71,746, extending its consolidation since February 7. US-spot ETFs record an outflow of $403.90 million through Thursday, pointing to the fifth consecutive week of withdrawals.

Pi Network Price Forecast: PI recovery stalls amid profit-taking

Pi Network tests 50-day EMA support on Friday, after a 5% decline the previous day. PiScan data shows large deposits on CEXs totaling over 4 million PI tokens in the last 24 hours, reflecting an exodus of investors taking profits.

Bitcoin Price Annual Forecast: BTC holds long-term bullish structure heading into 2026

Bitcoin (BTC) is wrapping up 2025 as one of its most eventful years, defined by unprecedented institutional participation, major regulatory developments, and extreme price volatility.

Bitcoin: No recovery in sight

Bitcoin (BTC) price continues to trade within a range-bound zone, hovering around $67,000 at the time of writing on Friday, and falling slightly so far this week, with no signs of recovery.