|

Litecoin technical analysis: LTC/USD weekly bearish flag breakout

  • Litecoin price is trading in the red, with losses of 2.75%  the session on Monday.
  • LTC/USD is back within the control of the bears after a decent three-week run higher. 
  • Critical support at the $60 price mark has been breached, which allowed a fresh wave of selling.

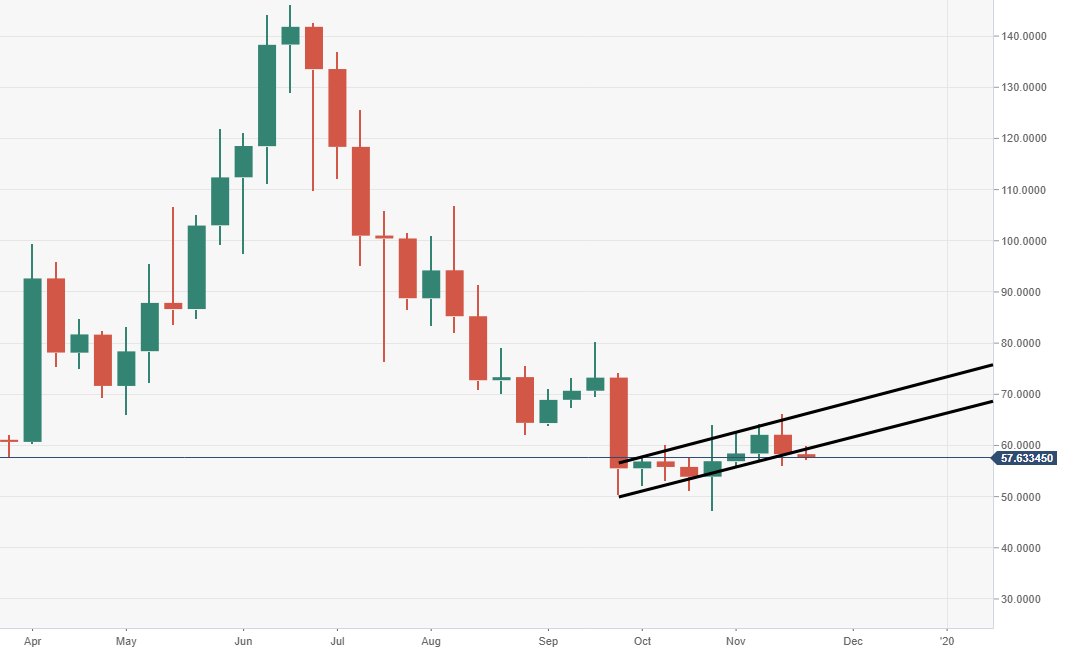
LTC/USD weekly chart

Price action via the weekly chart view broke out from a bearish flag pattern. 

LTC/USD daily chart

The price is testing a critical daily demand zone, $57-56 range.
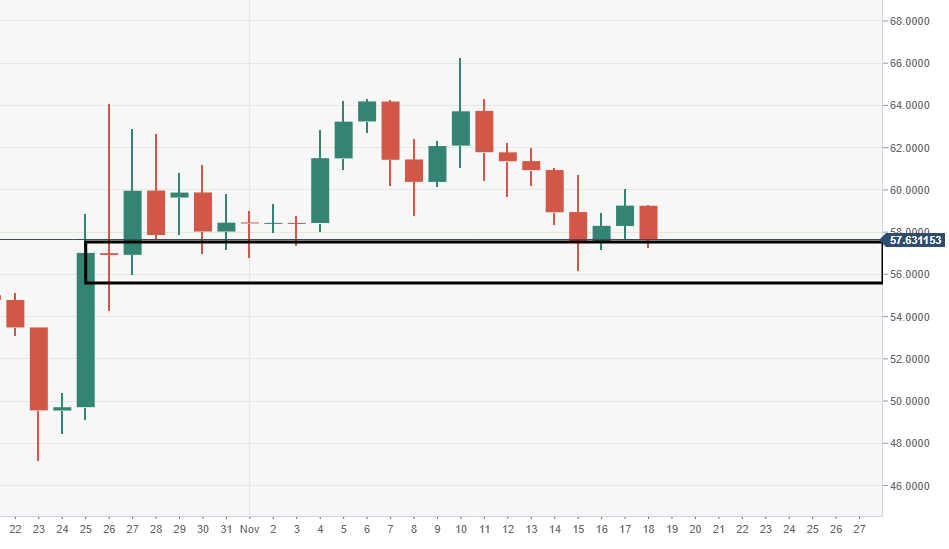
Spot rate:                  57.63

Relative change:      -2.75%

High:                         59.32

Low:                          57.26

LTC/USD

Overview
Today last price57.5209
Today Daily Change-1.7351
Today Daily Change %-2.93
Today daily open59.256
 
Trends
Daily SMA2060.3301
Daily SMA5057.4175
Daily SMA10064.7862
Daily SMA20085.0442
 
Levels
Previous Daily High60.0877
Previous Daily Low57.6537
Previous Weekly High66.2492
Previous Weekly Low56.1643
Previous Monthly High64.1049
Previous Monthly Low47.2078
Daily Fibonacci 38.2%59.1579
Daily Fibonacci 61.8%58.5835
Daily Pivot Point S157.9106
Daily Pivot Point S256.5652
Daily Pivot Point S355.4766
Daily Pivot Point R160.3446
Daily Pivot Point R261.4331
Daily Pivot Point R362.7786

Author

Ken Chigbo

Ken Chigbo

Independent Analyst

Ken has over 8 years exposure to the financial markets. He started his career as an analyst, covering a variety of asset classes; forex, fixed income, commodities and equities.

More from Ken Chigbo
Share:

Editor's Picks

XRP sell-off deepens amid weak retail interest, risk-off sentiment

Ripple (XRP) is edging lower around $1.36 at the time of writing on Wednesday, weighed down by low retail interest and macroeconomic uncertainty, which is accelerating risk-off sentiment.

Crypto Today: Bitcoin, Ethereum, XRP extend sell-off amid negative funding rates 

Bitcoin is down 15% in February and looks poised to extend its losses toward the yearly low of $60,000. Ethereum and Ripple are following in Bitcoin's footsteps, weighed down by a weak derivatives market. 

Hyperliquid tests key support as sell-side pressure intensifies

Hyerliquid (HYPE) drops to its 50-day Exponential Moving Average (EMA) at $28.85 at the time of writing on Wednesday, extending a decline of roughly 10% so far this week. 

Stellar Price Forecast: XLM risks revisiting $0.136 as sell-off continues

Stellar is trading below $0.160 at the time of writing on Wednesday, extending its correction for the fifth consecutive day. The bearish price action is further supported by rising short bets and declining Open Interest in the derivatives market. 

Bitcoin Price Annual Forecast: BTC holds long-term bullish structure heading into 2026

Bitcoin (BTC) is wrapping up 2025 as one of its most eventful years, defined by unprecedented institutional participation, major regulatory developments, and extreme price volatility.

Bitcoin: The worst may be behind us

Bitcoin (BTC) price recovers slightly, trading at $65,000 at the time of writing on Friday, after reaching a low of $60,000 during the early Asian trading session. The Crypto King remained under pressure so far this week, posting three consecutive weeks of losses exceeding 30%.