Litecoin Technical Analysis: LTC/USD victim of profit-taking.
- Litecoin on Tuesday was seen nursing losses of around 1% well into the second half of the session.
- LTC/USD is supported from further downside for now by ascending trend line, seen via the near-term view (15-minute).

LTC/USD 15-minute chart
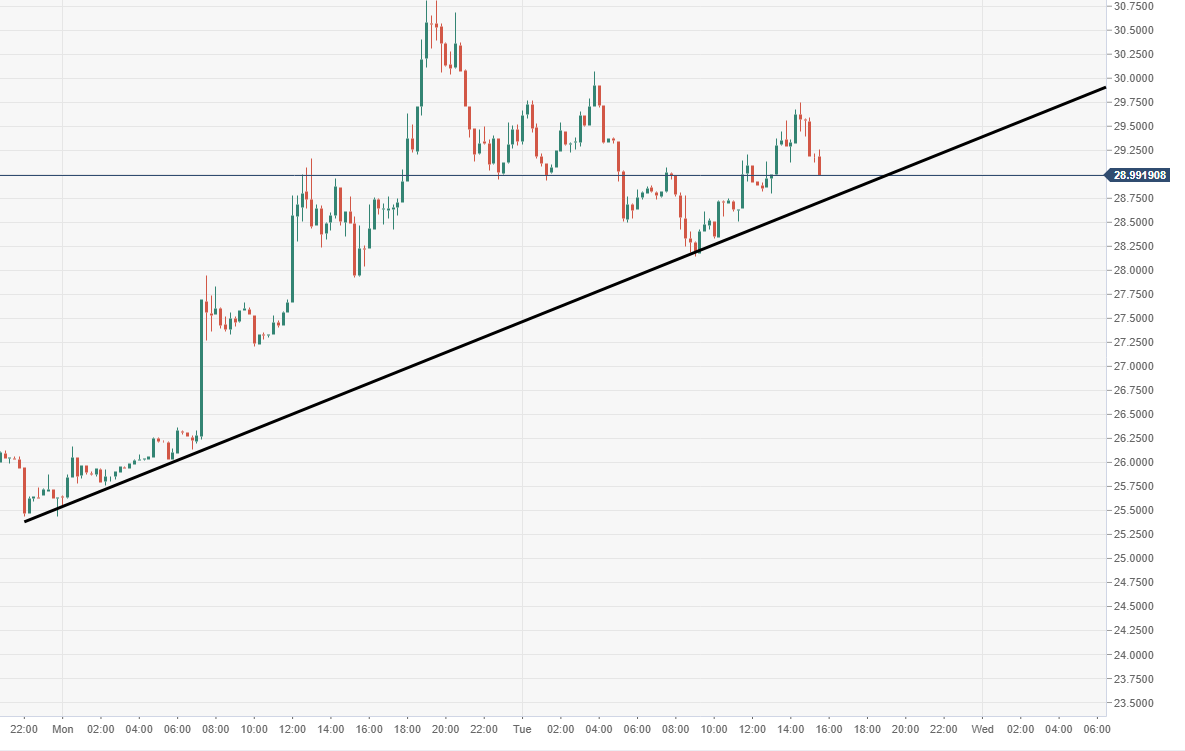
Spot rate: 29.06
Relative change: -1.12%
High: 29.74
Low: 28.14
Trend: Bullish
Resistance 1: 31.58, daily pivot point resistance.
Resistance 2: 33.83, daily pivot point resistance.
Resistance 3: 36.85, daily pivot point resistance.
Support 1: 28.70, near-term ascending trend line.
Support 2: 26.32, daily pivot point support.
Support 3: 23.30, daily pivot point support.
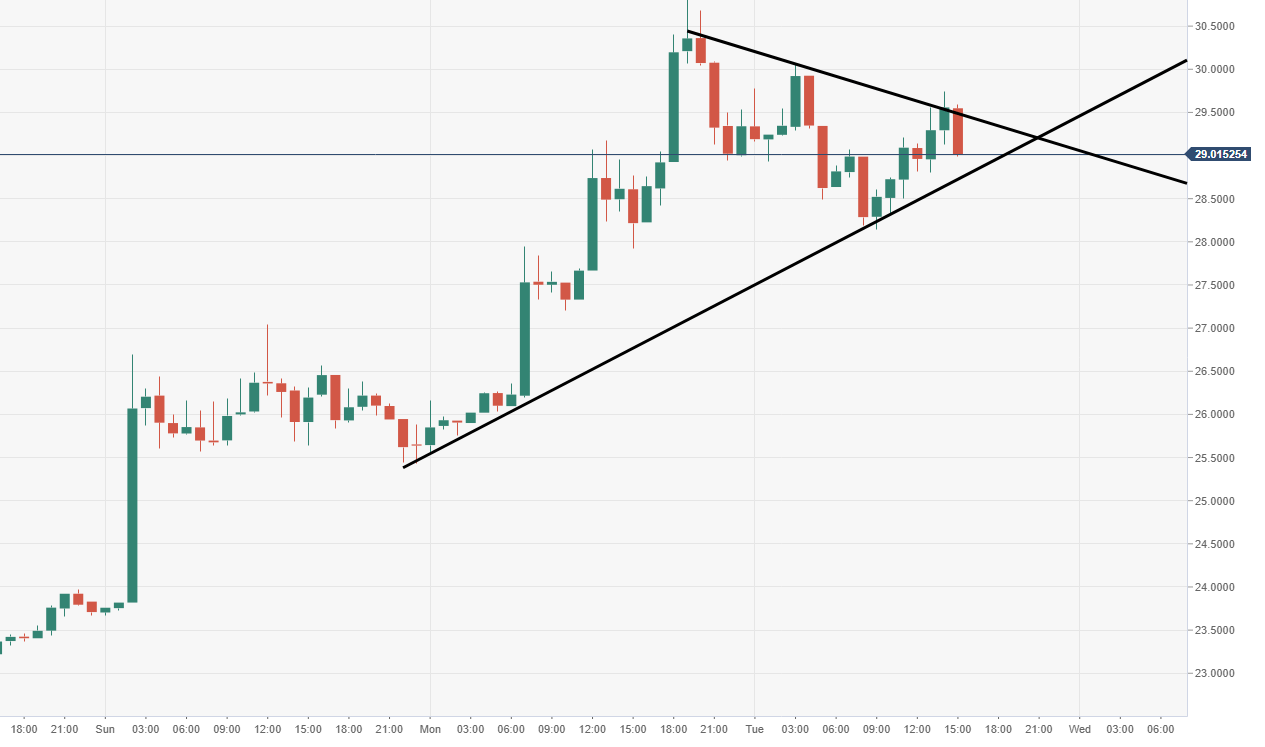
LTC/USD 60-minute chart
- Upside is capped by a descending trend line marked on the chart below, after failing to breakdown supply heading into $31.
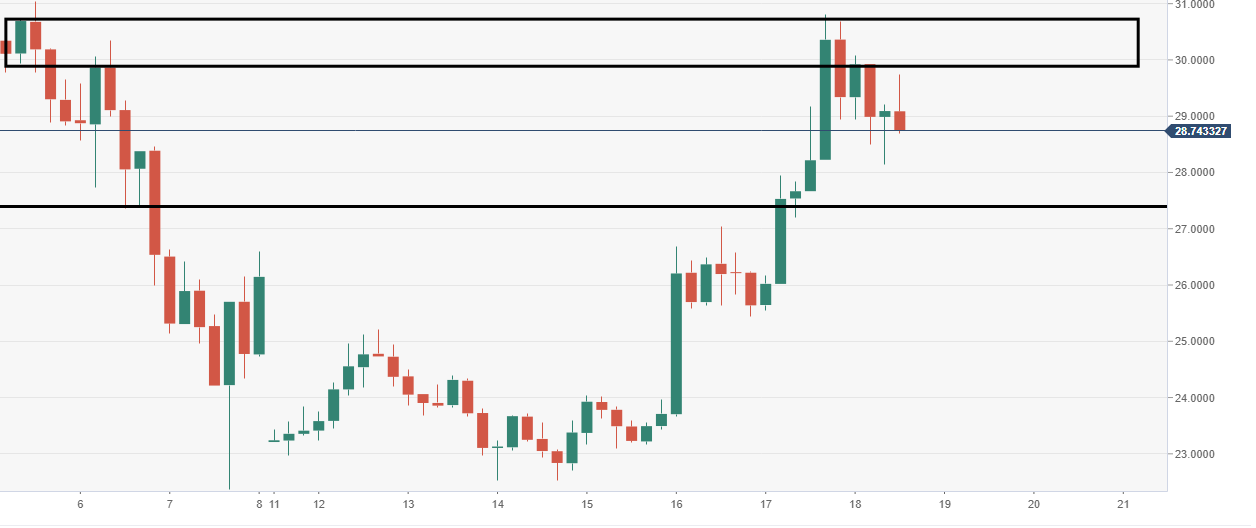
LTC/USD 4-hour chart
- Profit taking takes place as bulls run into a barrier of supply in the approach to $31.
Author

Ken Chigbo
Independent Analyst
Ken has over 8 years exposure to the financial markets. He started his career as an analyst, covering a variety of asset classes; forex, fixed income, commodities and equities.


