Litecoin Technical Analysis: LTC/USD subject to a breakout from bearish pennant
- Litecoin price nursing losses over 2% in early part of Thursday.
- LTC/USD price action moving within a bearish pennant pattern, subject to a break lower.

LTC/USD 60-minute chart
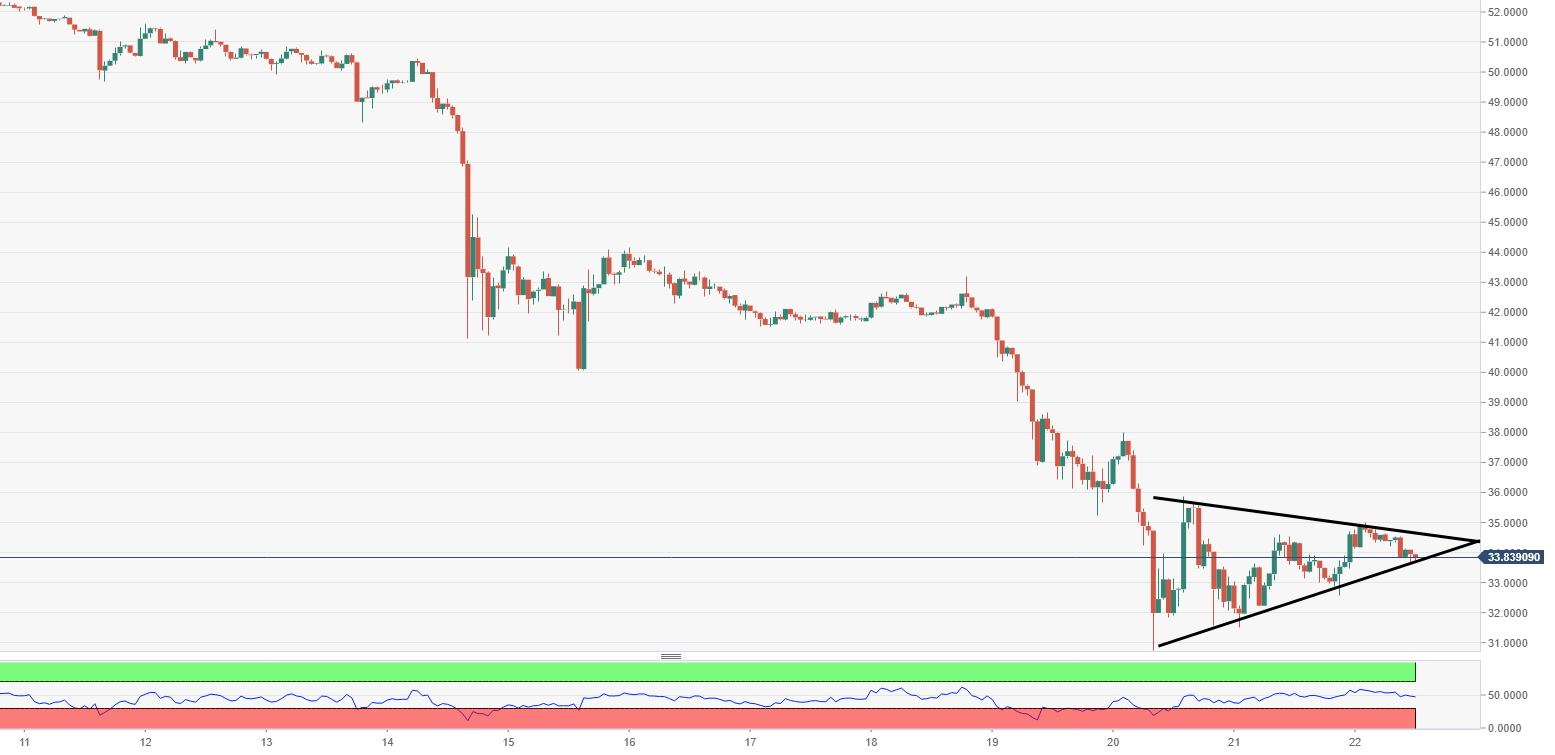
Spot rate: 33.86
Relative change: -2.08%
High: 35.01
Low: 32.58
Trend: Bearish
Support 1: 33.61, lower part of pennant.
Support 2: 31.51, daily pivot point support.
Support 3: 30.42, daily pivot point support.
Resistance 1: 34.71, upper part of pennant.
Resistance 2: 35.69, daily pivot point resistance.
Resistance 3: 36.78, daily pivot point resistance.
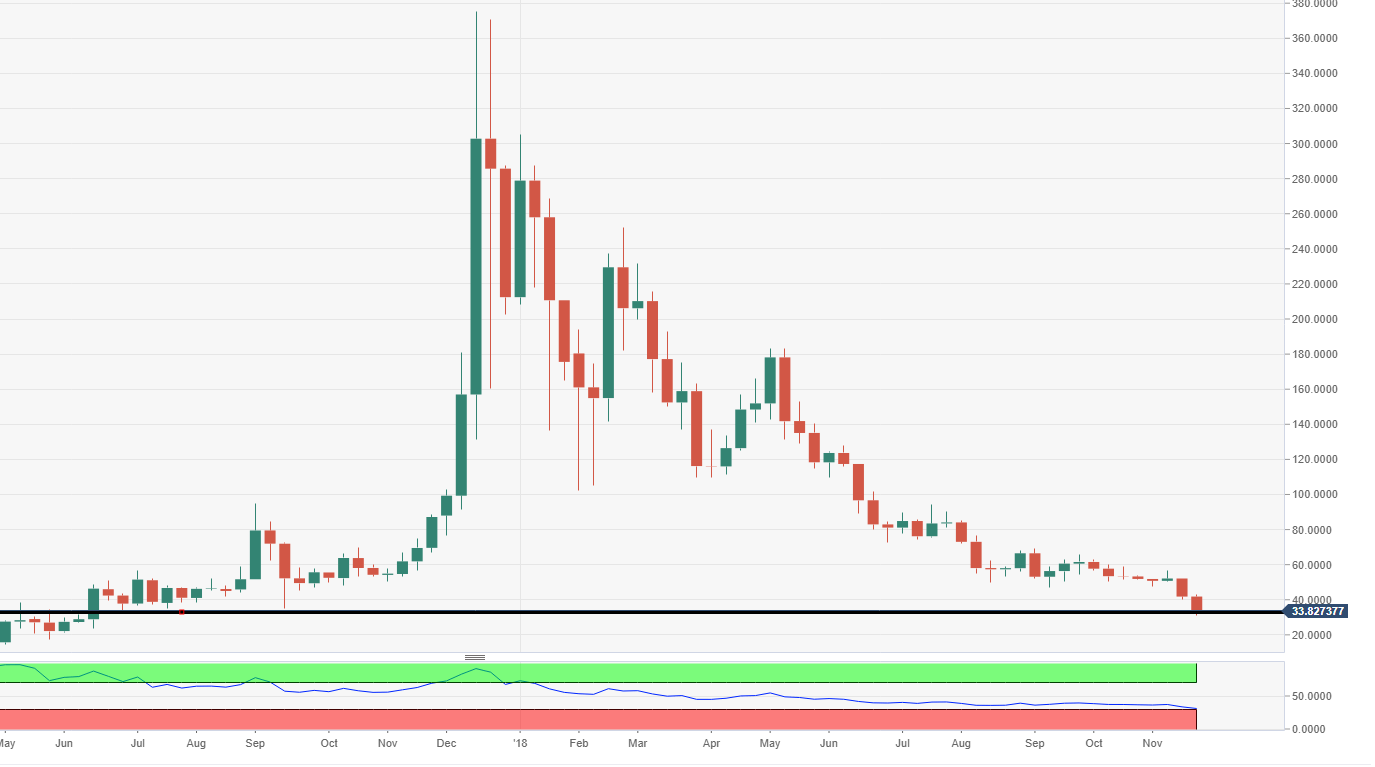
LTC/USD weekly chart
- LTC/USD weekly chart shows price flirting with vital support level around $33, RSI is oversold, a bounce could be around the corner.
Author

Ken Chigbo
Independent Analyst
Ken has over 8 years exposure to the financial markets. He started his career as an analyst, covering a variety of asset classes; forex, fixed income, commodities and equities.


