Litecoin Technical Analysis: LTC/USD potential for a fast fall to $22 on the cards
- Litecoin on Thursday nursing minor losses of around 1% in the second half of the session.
- LTC/USD daily chart view like several of its peers is forming a bearish flag pattern.

LTC/USD 15-minute chart
- Decent near-term buying picked up within the $30.00 territory, preventing free-fall.
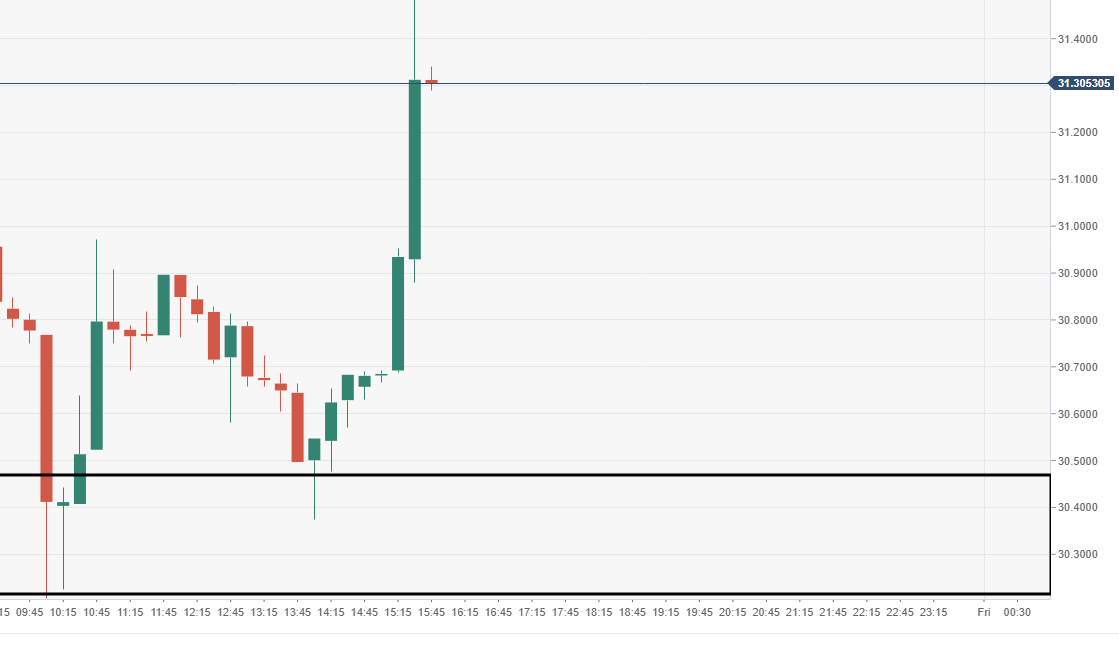
Spot rate: 31.33
Relative change: -0.96%
High: 31.79
Low: 30.20
Trend: Bearish
Support 1: 30.97, daily pivot point support.
Support 2: 30.31, daily pivot point support.
Support 3: 29.62, daily pivot point support.
Resistance 1: 32.31, daily pivot point resistance.
Resistance 2: 33.00, daily pivot point resistance.
Resistance 3: 33.00, daily pivot point resistance.
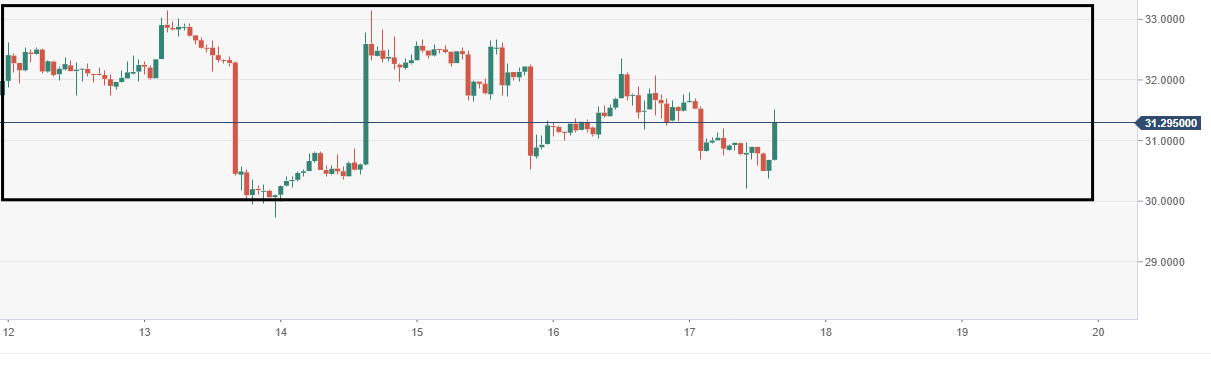
LTC/USD 60-minute chart
- . Range-block formation, upper part of pattern seen at $33.25, low down at $30.00.
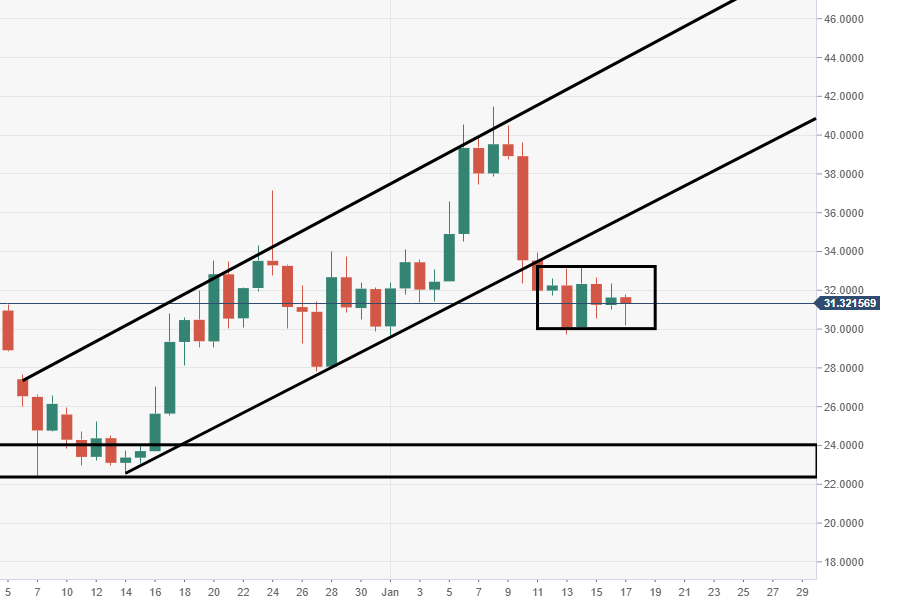
LTC/USD daily chart
- Price action is moving within a range-block, following the prior week breakout from ascending trend line.
Author

Ken Chigbo
Independent Analyst
Ken has over 8 years exposure to the financial markets. He started his career as an analyst, covering a variety of asset classes; forex, fixed income, commodities and equities.


