|

Litecoin technical analysis: LTC/USD bears gain a slight upper hand in the early hours of Friday

  • LTC/USD has gone down from $99 to $97.75 in the early hours of Friday.
  • Moving average convergence divergence (MACD) shows sustained bullish momentum despite bearish price action.

LTC/USD daily chart

fxsoriginal

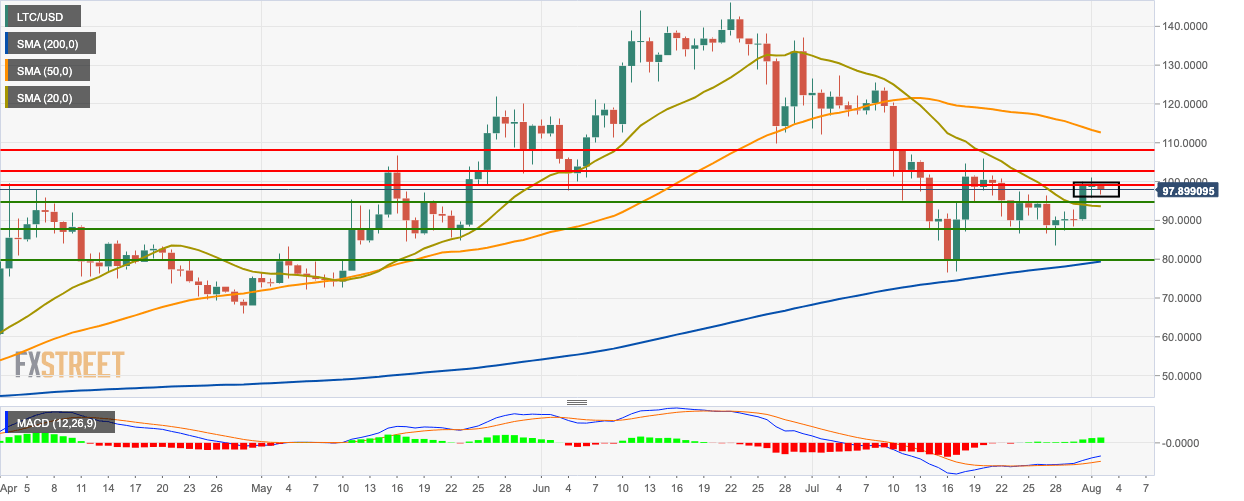
LTC/USD has had a bearish start to the day after the price fell from $99 to $97.75 in the early hours of Friday. The price is trending below the 50-day simple moving average (SMA 50 curve, while it is above the SMA 20 and SMA 200 curves. The moving average convergence divergence (MACD) shows sustained bullish momentum despite bearish price action.

LTC/USD 4-hour chart

fxsoriginal

The 4-hour price broke up from the green Ichimoku cloud before the bears dipped it back inside the red Ichimoku cloud. The price initially found support on the upward trending line, before the bears broke through it. The relative strength index (RSI) indicator shows is creeping right along the overbought zone.

LTC/USD hourly chart

fxsoriginal

The hourly price is currently trending in the lower half of the 20-day Bollinger band and below the SMA 20 curve. The price is also trending below the SMA 200 and SMA 50 curves. The Elliot oscillator has had five straight bearish sessions.

Key Levels

LTC/USD

Overview
Today last price97.858
Today Daily Change-1.0261
Today Daily Change %-1.04
Today daily open98.8841
 
Trends
Daily SMA2093.7768
Daily SMA50113.3007
Daily SMA100103.9426
Daily SMA20079.0258
Levels
Previous Daily High100.9918
Previous Daily Low95.8322
Previous Weekly High101.588
Previous Weekly Low86.7455
Previous Monthly High127.2049
Previous Monthly Low76.4679
Daily Fibonacci 38.2%99.0208
Daily Fibonacci 61.8%97.8032
Daily Pivot Point S196.147
Daily Pivot Point S293.4099
Daily Pivot Point S390.9875
Daily Pivot Point R1101.3065
Daily Pivot Point R2103.7289
Daily Pivot Point R3106.466


Author

Rajarshi Mitra

Rajarshi Mitra

Independent Analyst

Rajarshi entered the blockchain space in 2016. He is a blockchain researcher who has worked for Blockgeeks and has done research work for several ICOs. He gets regularly invited to give talks on the blockchain technology and cryptocurrencies.

More from Rajarshi Mitra
Share:

Editor's Picks

Bitcoin steadies as traders eye US–Iran talks

Bitcoin (BTC) price is stabilizing around $68,000 at the time of writing on Thursday after a 6.2% relief rally the previous day amid a broader downward trend.

Ripple holds modest gains as open interest hits one-year low

Ripple (XRP) rises alongside major crypto assets to trade above $1.43 at the time of writing on Thursday. The slow but steady recovery comes after the remittance token declined to a weekly low of $1.31 on Tuesday, as investors navigated key changes in the United States (US) tariff policy.

Meme Coins Price Prediction: Dogecoin, Shiba Inu, Pepe struggle to extend gains

Meme coins, including Dogecoin (DOGE), Shiba Inu (SHIB), and Pepe (PEPE), have remained stable so far on Thursday after rising around 5%-10%-5% respectively on Wednesday, suggesting a lack of sustained bullish momentum.

Solana strikes key resistance with double-digit gains

Solana (SOL) trades at $88 at press time on Thursday, after an 11% upswing the previous day within a broader consolidation range of roughly three weeks. Institutional demand for Solana heightens as US spot SOL Exchange Traded Funds (ETFs) record $30 million of inflow on Wednesday.

Bitcoin Price Annual Forecast: BTC holds long-term bullish structure heading into 2026

Bitcoin (BTC) is wrapping up 2025 as one of its most eventful years, defined by unprecedented institutional participation, major regulatory developments, and extreme price volatility.

Bitcoin: No recovery in sight

Bitcoin (BTC) price continues to trade within a range-bound zone, hovering around $67,000 at the time of writing on Friday, and falling slightly so far this week, with no signs of recovery.