Litecoin technical analysis: Bulls consolidate the recovery above 61.8% Fib level


  • Saturday’s recovery drives the bulls to regain the 61.8% Fib level.
  • Coin awaits fresh catalysts for the recovery to gain further momentum.

The fifth most widely traded cryptocurrency, Litecoin, consolidates the recovery from four-day lows of 58.78 in Saturday’s early European trading, tracking the rebound seen across the crypto space. Although the price has regained the 61 handle, the bulls need some fresh trading impetus to recover further towards last week’s highs at 64.32. Meanwhile, the coin loses over 1.50% in the last 24 hours., representing a market capitalization of $ 3.89B, or 1.62% of the total cryptocurrency market cap. 

LTC/USD, 1-hour chart


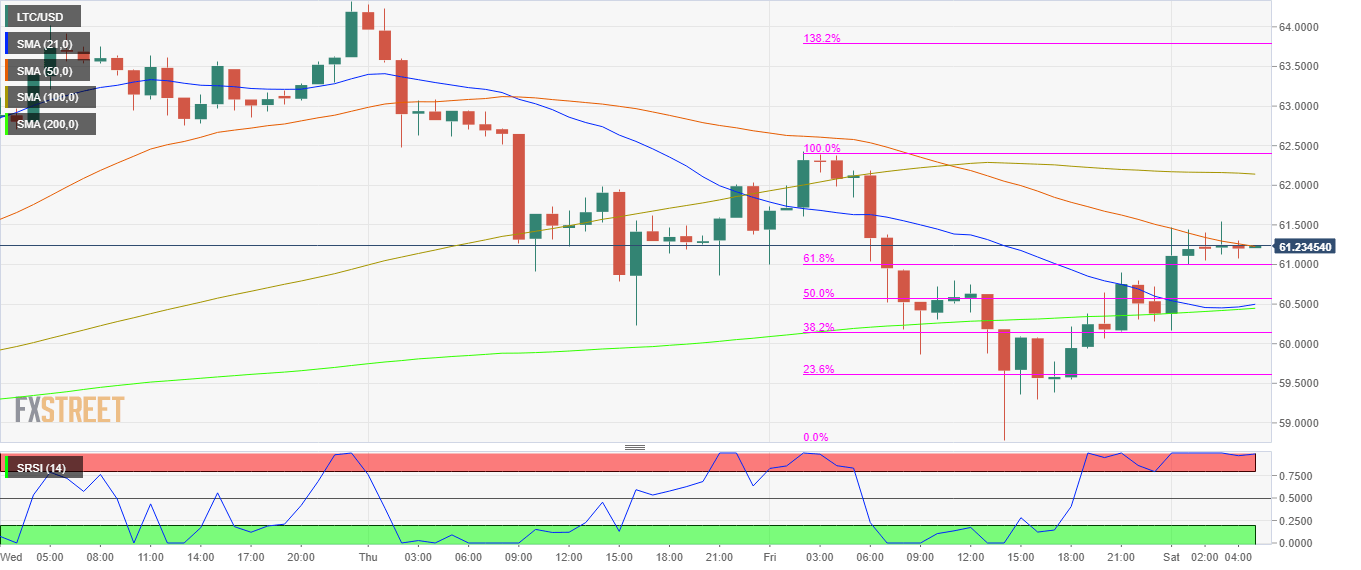
  • The coin consolidates above 61.8% Fibonacci Retracement (Fib) of the latest decline.
  • Hourly Relative Strength Index (RSI) steadies in the overbought territory, suggesting that the recovery could be losing momentum
  • Horizontal hourly 100-Simple Moving Average (HMA) at 62.15 is the level to defend for the bulls.
  • The bearish trend to resume should the price breach the key support (confluence) zone circa 60.50.


LTC/USD daily chart


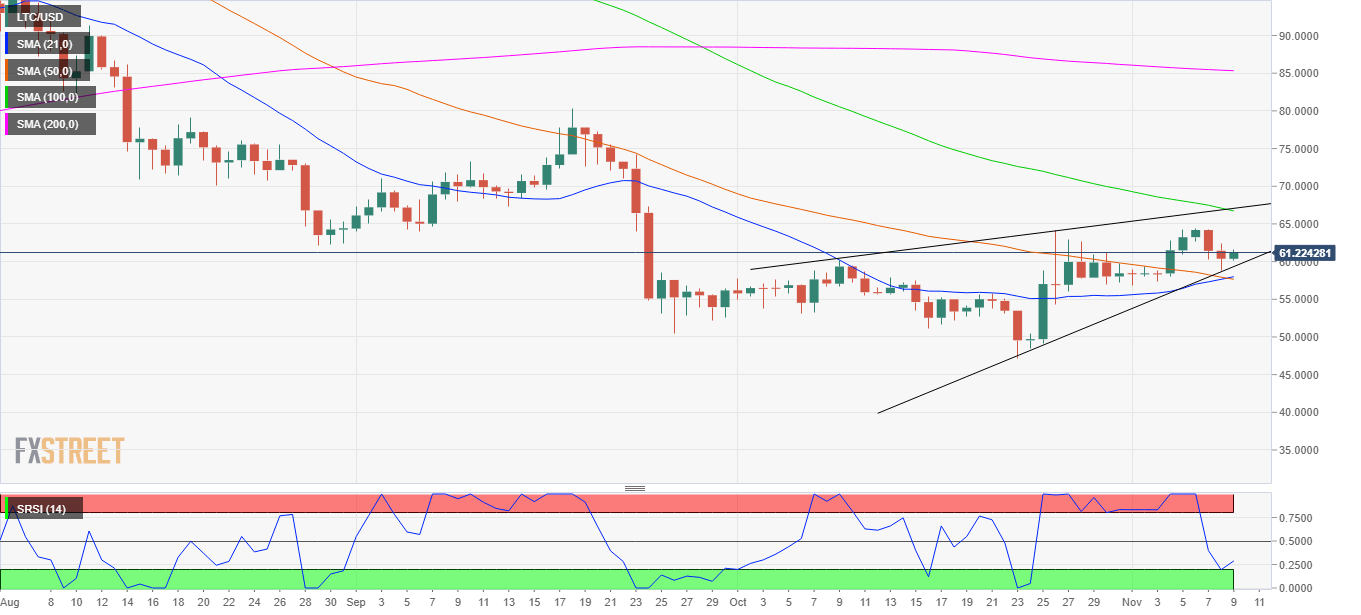
  • Comfortable in a rising wedge, awaits fresh catalyst for a sustained breakout.
  • The spot is currently trapped between bearish 100-Daily Moving Average (DMA) at 66.70 and 58 (confluence of 21 and 50-DMA).
  • Daily Relative Strength Index (RSI) is pointing upwards towards the 50 level, indicating further upside room.
  • Bulls need to take out the stiff resistances around 64.30 to strengthen the recovery.


LTC/USD Levels to watch

LTC/USD

Overview
Today last price 61.34
Today Daily Change 1.2142
Today Daily Change % 2.01
Today daily open 60.3807
 
Trends
Daily SMA20 57.8337
Daily SMA50 58.3291
Daily SMA100 67.5196
Daily SMA200 85.4992
 
Levels
Previous Daily High 62.4293
Previous Daily Low 58.7843
Previous Weekly High 64.3264
Previous Weekly Low 57.3543
Previous Monthly High 64.1049
Previous Monthly Low 47.2078
Daily Fibonacci 38.2% 60.1767
Daily Fibonacci 61.8% 61.0369
Daily Pivot Point S1 58.6336
Daily Pivot Point S2 56.8865
Daily Pivot Point S3 54.9886
Daily Pivot Point R1 62.2786
Daily Pivot Point R2 64.1765
Daily Pivot Point R3 65.9236


Information on these pages contains forward-looking statements that involve risks and uncertainties. Markets and instruments profiled on this page are for informational purposes only and should not in any way come across as a recommendation to buy or sell in these assets. You should do your own thorough research before making any investment decisions. FXStreet does not in any way guarantee that this information is free from mistakes, errors, or material misstatements. It also does not guarantee that this information is of a timely nature. Investing in Open Markets involves a great deal of risk, including the loss of all or a portion of your investment, as well as emotional distress. All risks, losses and costs associated with investing, including total loss of principal, are your responsibility. The views and opinions expressed in this article are those of the authors and do not necessarily reflect the official policy or position of FXStreet nor its advertisers. The author will not be held responsible for information that is found at the end of links posted on this page.

If not otherwise explicitly mentioned in the body of the article, at the time of writing, the author has no position in any stock mentioned in this article and no business relationship with any company mentioned. The author has not received compensation for writing this article, other than from FXStreet.

FXStreet and the author do not provide personalized recommendations. The author makes no representations as to the accuracy, completeness, or suitability of this information. FXStreet and the author will not be liable for any errors, omissions or any losses, injuries or damages arising from this information and its display or use. Errors and omissions excepted.

The author and FXStreet are not registered investment advisors and nothing in this article is intended to be investment advice.

Join Telegram

Recommended content


Recommended Content

Editors’ Picks

MANTA suffers 4% pullback after unlocking tokens worth $40 million

MANTA suffers 4% pullback after unlocking tokens worth $40 million

Manta Network (MANTA) unlocked over 8% of its circulating supply on Thursday. The unlocked tokens were airdropped and distributed in public sale, according to data from Tokenunlocks. 

More Cryptocurrencies News

XRP struggles to recover as lingering Ripple lawsuit could reach Supreme Court, former SEC litigator says

XRP struggles to recover as lingering Ripple lawsuit could reach Supreme Court, former SEC litigator says

The SEC vs. Ripple potential showdown at the Supreme Court is likely, says former SEC litigator Ladan Stewart. XRP Ledger calls developers, businesses and investors to build on the blockchain, extending Apex 2024 registration until April 30. 

More Ripple News

Bitcoin Layer 2 Merlin chain TVL climbs 20%, defying broad market correction

Bitcoin Layer 2 Merlin chain TVL climbs 20%, defying broad market correction

Merlin chain’s TVL added 20% this week, and crossed $800 million on Thursday. Bitcoin Layer 2 assets noted double-digit losses in the past week. Stacks, Elastos, SatoshiVM, BVM are hit by a correction as Bitcoin hovers around $61,000. 

More Bitcoin News

If Bitcoin restarts bull run, these altcoins are likely to explode Premium

If Bitcoin restarts bull run, these altcoins are likely to explode

If Bitcoin’s consolidation ends and the bull run resumes, altcoins are likely going to trigger a massive rally. Last cycle’s hot tokens like SOL, AVAX, WIF, ONDO, etc., could see renewed enthusiasm. 

More Cryptocurrencies News

Bitcoin: BTC’s rangebound movement leaves traders confused

Bitcoin: BTC’s rangebound movement leaves traders confused

Bitcoin (BTC) price has been hovering around the $70,000 psychological level for a few weeks, resulting in a rangebound movement. This development could lead to a massive liquidation on either side before a directional move is established. 

Read full analysis

BTC

ETH

XRP