Litecoin price to hit $300 if LTC bulls can overcome this hurdle
- Litecoin price consolidates below a crucial demand zone extending from $210 to $232.
- A decisive close above this barrier will propel LTC to $300.
- On-chain metrics reveal massive headwinds for the altcoin.

Litecoin price is in a tough spot as technicals hint at a bullish outlook if the altcoin can manage to close above one particular hurdle. However, on-chain metrics indicate that an ascent would be an uphill battle. Therefore, investors need to be careful with taking on LTC.
Litecoin price in an ambiguous situation
Litecoin price set up a swing high at $232 on September 5 and began its 40% descent. This downswing breached the previous swing low at $162, indicating a downswing is in play. Therefore, it is obvious to assume that a bunch of traders positioned themselves short on the October 21 swing high at $214.
The stop losses for these positions are placed above the $210 to $232 supply zone. A decisive daily close above $232 will put many investors that went short in a challenging situation and force them to buy back their positions at a higher price.
If Litecoin price stays above this barrier, it would be an indication to go long. A perfect retest of the $210 to $232 demand zone will likely propel Litecoin price to the next hurdle at $294. In some cases, the uptrend might extend to a psychological level at $300. This run-up from the current position would constitute a 55% gain.
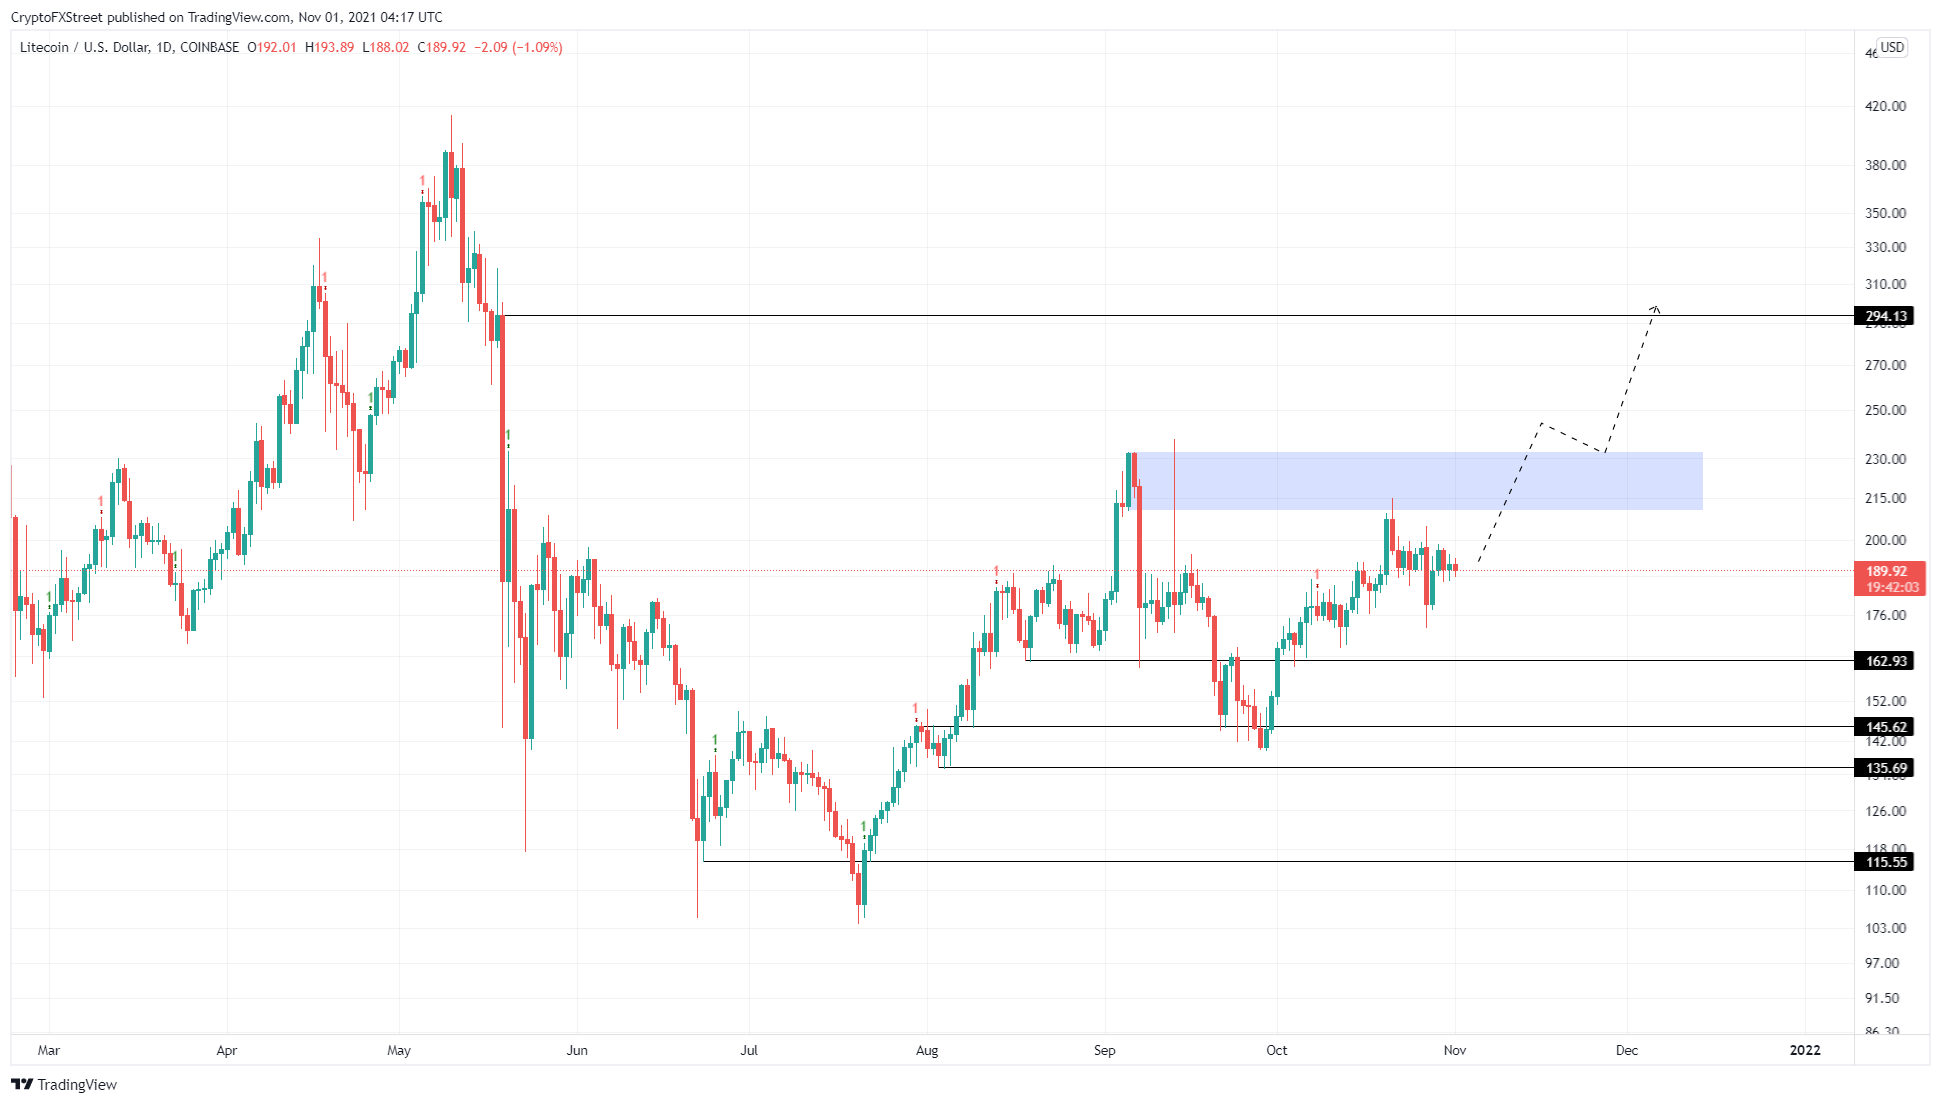
LTC/USDT 1-day chart
Supporting this bullish outlook for Litecoin price is the 365-day and the 30-day Market Value to Realized Value (MVRV) model. This on-chain metric is used to determine the average profit/loss of investors that purchased LTC over the past year or month.
From the looks of it, both time frames show that the MVRV is in the safe zone, suggesting that a sell-off from the holders is unlikely since they are not profitable.
 [09.22.57, 01 Nov, 2021]-637713397558416017.png)
LTC 30-day, 365-day MVRV chart
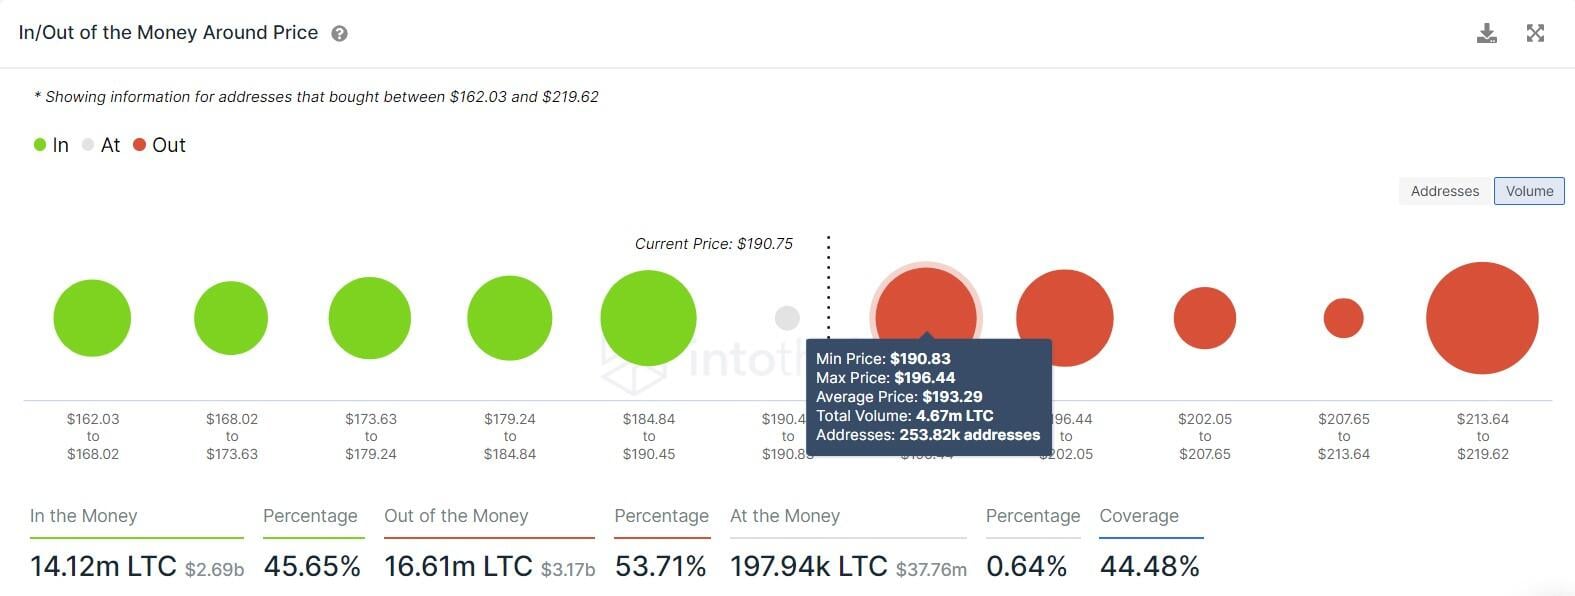
While the MVRV chart shows the possibility of an uptrend, IntoTheBlock’s In/Out of the Money Around Price (IOMAP) model shows that LTC will face resistance from a massive chunk of underwater investors.
At roughly $200, nearly 132,000 addresses that purchased 4.73 million LTC are “Out of the Money.” Beyond this, a similar cluster of underwater investors bought 12.59 million LTC at an average price of $265.09.
Therefore, clearing the demand zone’s upper limit at $232 will flip the first chunk of underwater investors profitable and serve as a tailwind. If this buying pressure persists and propels LTC past $265, it will solidify Litecoin price’s bullish thesis, i.e. a move to $300.
LTC IOMAP chart
However, a failure to flip $200 will provide bears an advantage and knock LTC down to the $162 support floor. If Litecoin price breaks down the $135 foothold, it will invalidate the bullish thesis and drag LTC down with it and perhaps visit $115.
Author

Akash Girimath
FXStreet
Akash Girimath is a Mechanical Engineer interested in the chaos of the financial markets. Trying to make sense of this convoluted yet fascinating space, he switched his engineering job to become a crypto reporter and analyst.


