Litecoin Price Forecast: LTC rebounds on rising retail demand as Vanguard’s ETF move supports crypto markets
- Litecoin is up nearly 3% on Wednesday, extending a bounce back within a falling wedge pattern.
- Derivatives demand for Litecoin picks up as the Vanguard Group allows crypto ETFs.
- The technical outlook remains bullish amid an impending crossover in the MACD indicator.

Litecoin (LTC) is up 3% by press time on Wednesday amid increased demand for cryptocurrencies with listed Exchange Traded Funds (ETFs), as the Vanguard Group has approved third-party ETFs on its platform. Derivatives data reveal a surge in demand, even from large-wallet investors, corroborating the rebound within a falling wedge pattern, suggesting further gains.
Vanguard’s ETF move fuels demand in Litecoin derivatives
Litecoin, one of the blue-chip cryptocurrencies with an ETF, is gaining momentum following Vanguard Group’s decision to allow crypto market exposure through third-party ETFs. This decision extends exposure to the Canary Litecoin ETF (LTCC) for its conservative investors, potentially increasing capital flows into digital assets.
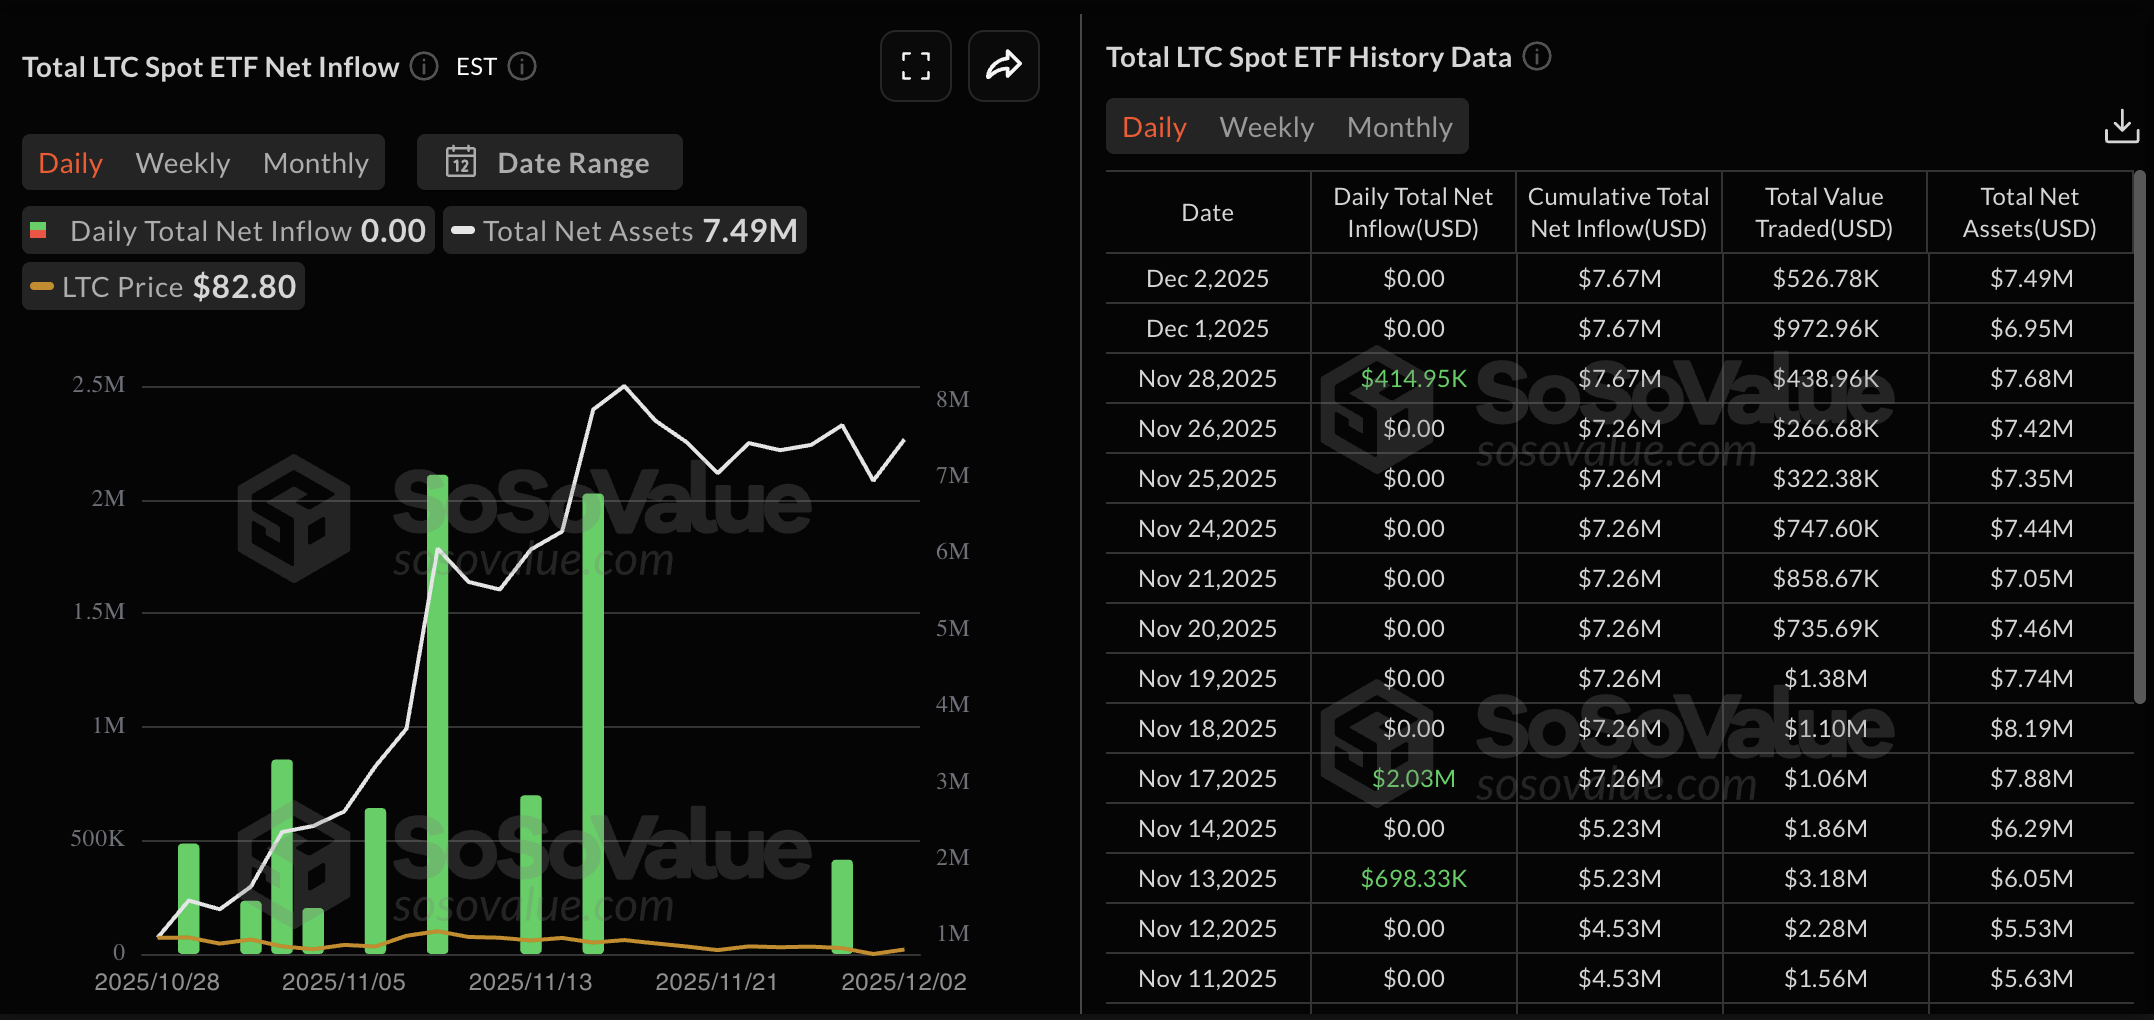
Still, according to the Sosovalue data, the Litecoin ETF saw a net-zero flow on Monday and Tuesday, keeping the cumulative net inflow at $7.67 million.
However, the Litecoin derivatives market saw a surge in demand, with its futures Open Interest (OI) jumping 4.41% over the last 24 hours to $440.26 million. This positional buildup on Litecoin futures reflects a renewed risk-on sentiment among investors. A larger wipeout of bearish positions in LTC derivatives also corroborated the investors' optimism. The 24-hour data shows short liquidations of $753,910 outpaced long liquidations of $29,330.

Additionally, the CryptoQuant data shows an increase in the average order size from large wallet investors, commonly known as whales. This increase in buy orders from whales in Litecoin futures reflects greater confidence and could further boost demand.

Technical outlook: Litecoin flashes bullish potential as momentum shifts
Litecoin extends a rebound from the support trendline formed by connecting the lows of October 17 and November 4. This marks an upcycle within a falling wedge pattern, with an overhead trendline connecting the highs of October 10 and November 9.
The path of least resistance for Litecoin targets the 50-day Exponential Moving Average (EMA) at $92.94, followed by the 200-day EMA at $99.51. If LTC clears the 200-day EMA, which is close to the resistance trendline, it would confirm an upside breakout of the falling wedge pattern.
The rebound brings a positive shift in the momentum indicators on the daily chart, as the Relative Strength Index (RSI) reaches 45, with a V-shaped rebound between the halfway line and the oversold zone. This indicates a reduction in bearish pressure, which would restore bullish momentum if the RSI exceeds the midline.
On a more positive note, the Moving Average Convergence Divergence (MACD) is close to surpassing the signal line on the daily chart. This would signal a bullish shift in trend momentum.
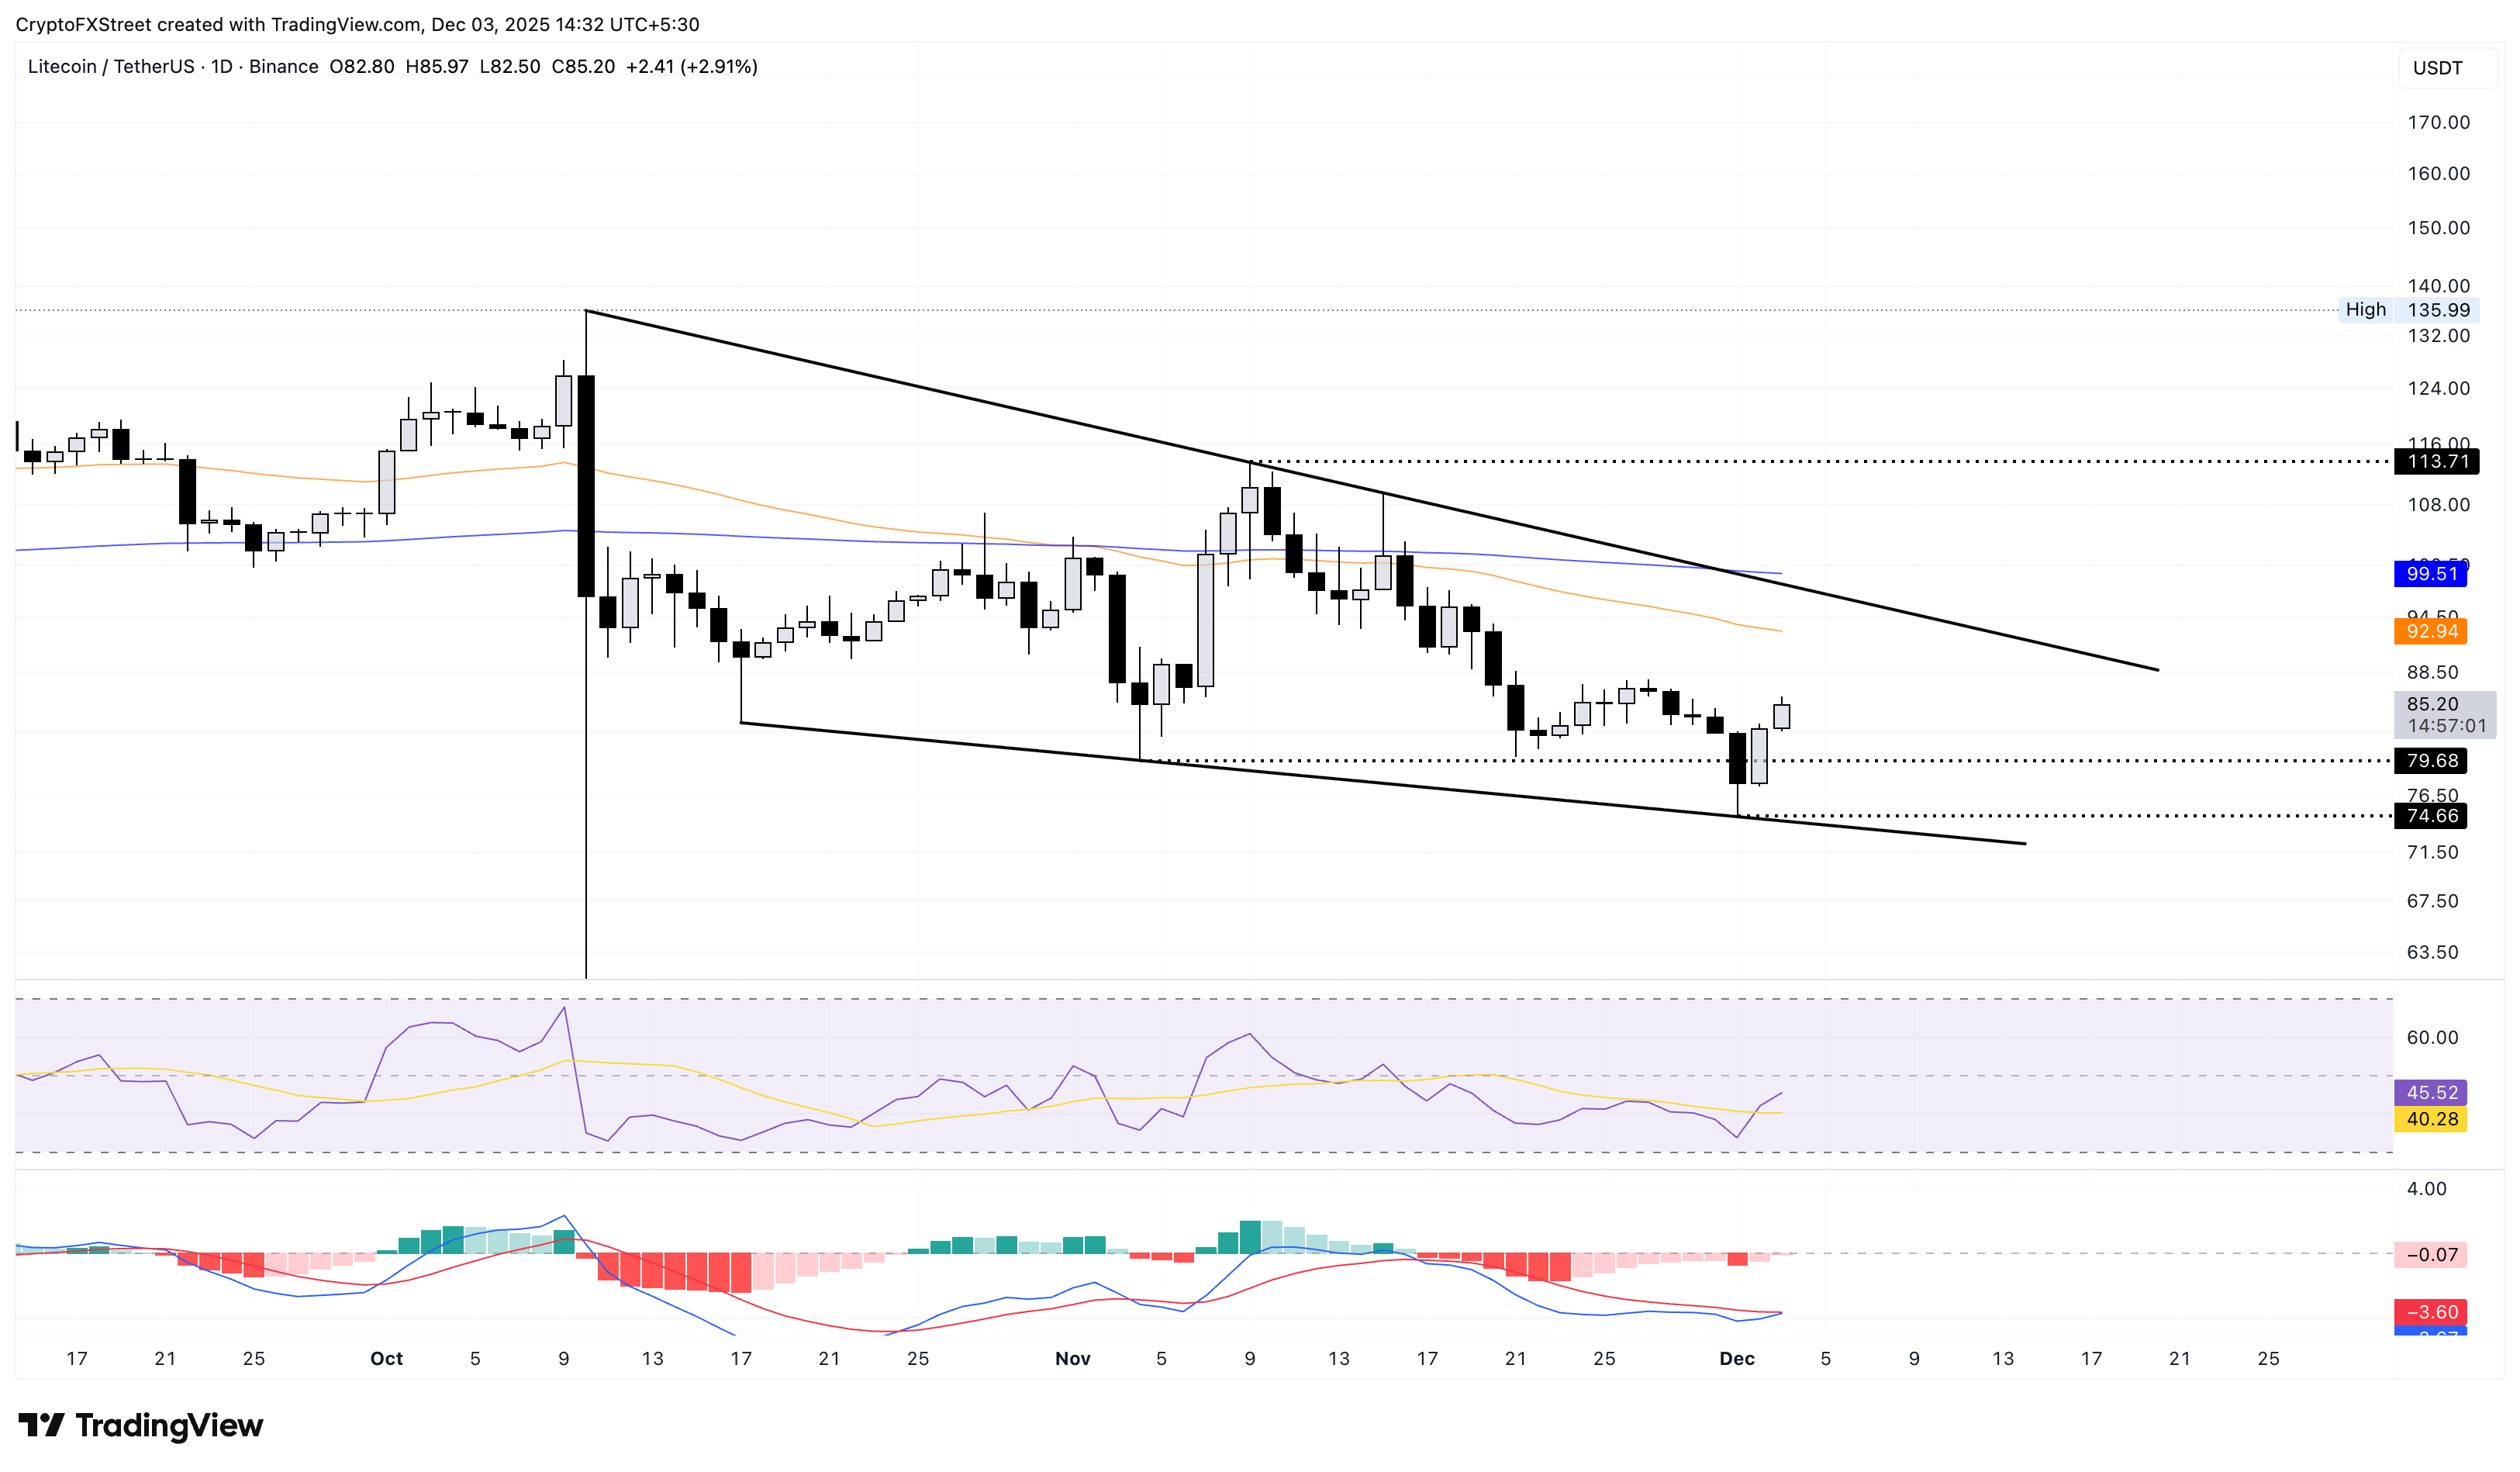
Looking down, if Litecoin loses momentum, it could find support at the November 4 and December 1 lows at $79.68 and $74.66, respectively.
Author

Vishal Dixit
FXStreet
Vishal Dixit holds a B.Sc. in Chemistry from Wilson College but found his true calling in the world of crypto.


