Litecoin Price Forecast: LTC eyes 22% advance to test its all-time high
- Litecoin price surged 16% over the last 24 hours, indicating an uptick in bullish momentum.
- A minor retracement to the weekly demand zone extending from $217 to $304 will most likely propel LTC to an all-time high at $420.
- On-chain metrics hint at increased interest among investors over the last couple of weeks.

Litecoin price performance faltered along the way but has not come to a standstill. With its 2018 all-time high only a minor upswing away, investors seem to be getting on the LTC bandwagon.
Litecoin price to come full circle
The weekly chart shows that Litecoin price has sliced through the supply barrier that stretches from $217 to $304. This area of resistance was set up in 2018 and the recent uptick in bullish momentum has caused Litecoin price to flip this zone into a support level.
Although unlikely, LTC could retrace to the upper boundary of this zone before embarking on a journey to tag its all-time high at $420.
If this ceiling is shattered, investors can expect a FOMO-fueled rally similar to what Ethereum price experienced as it climbed to new highs on May 4.
Under these circumstances, Litecoin price could surge another 58% to the 161.8% Fibonacci extension level at $665, obtained by connecting the swing high and low in 2018.
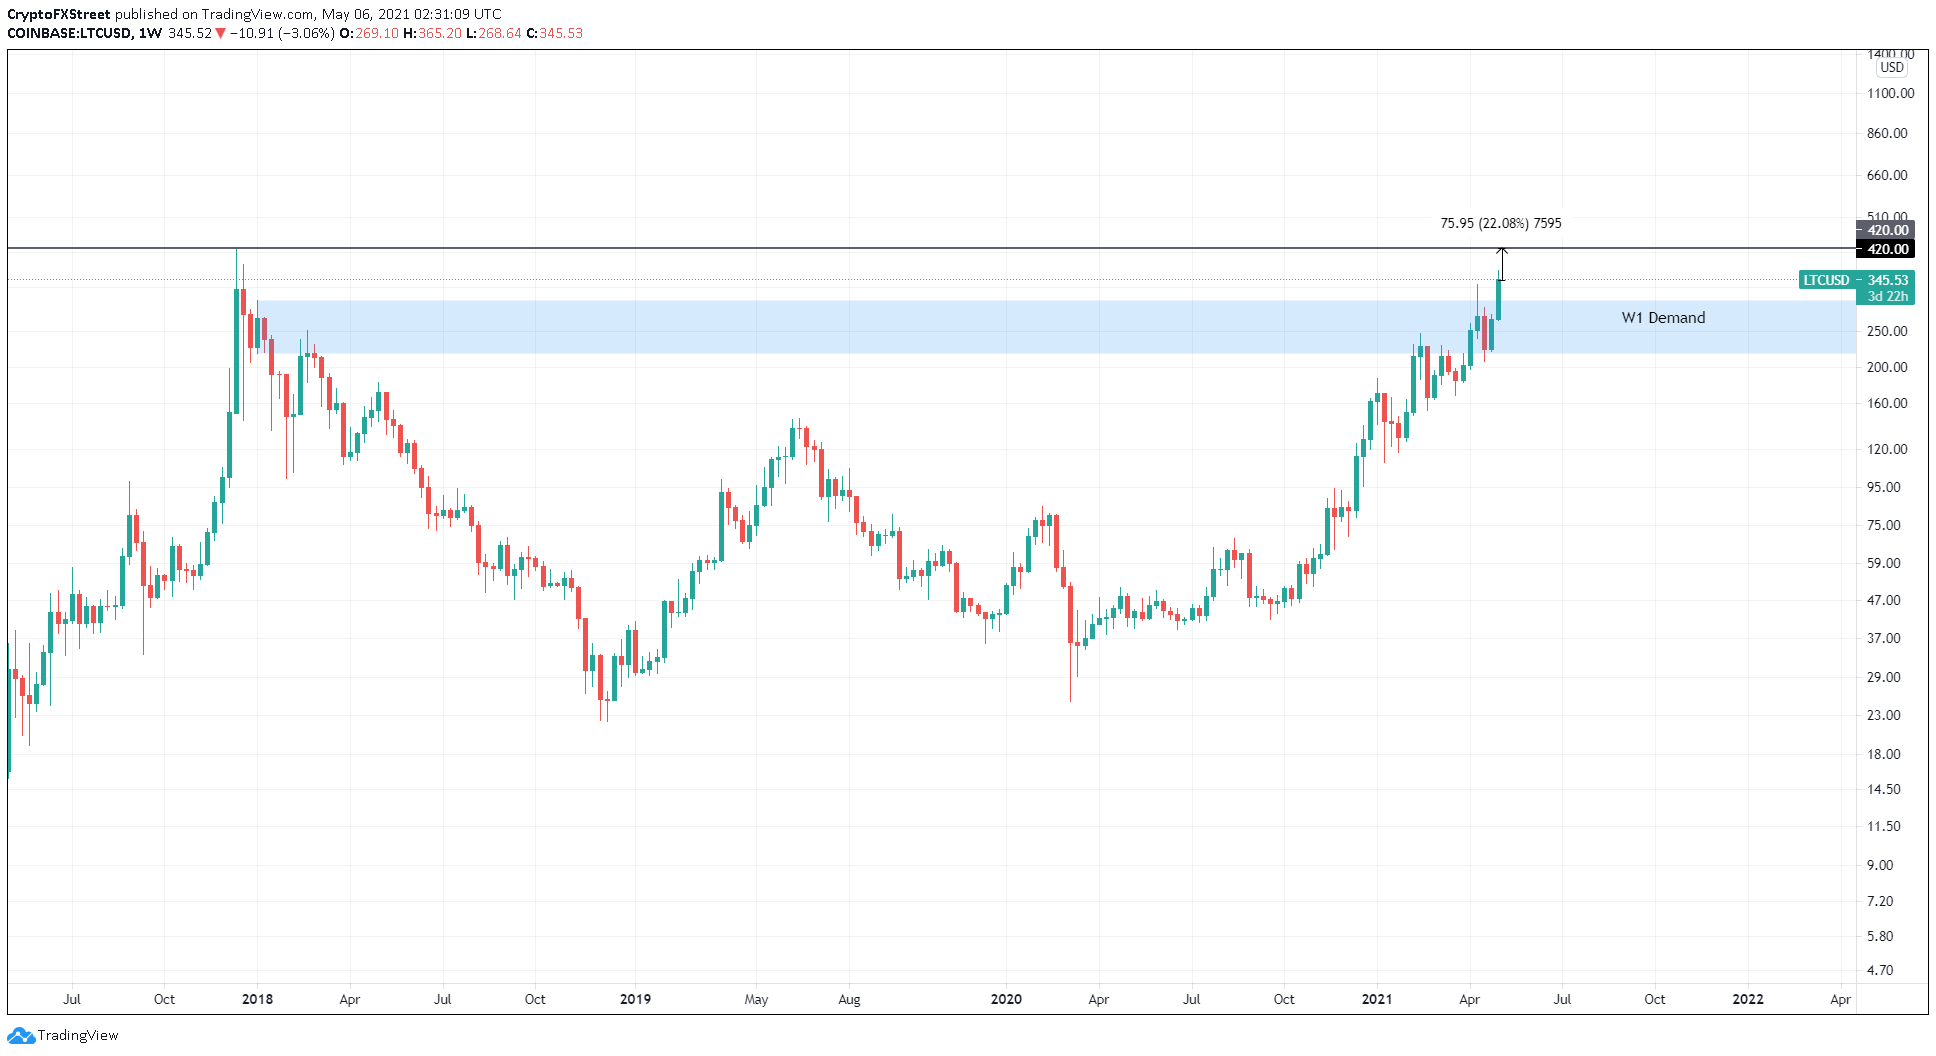
LTC/USDT 1-week chart
Supporting this optimistic outlook is a 30% increase in the number of new addresses joining the LTC network. This growth from 124,000 to 161,000 over the past month notes that investors are interested in Litecoin price at the current levels.
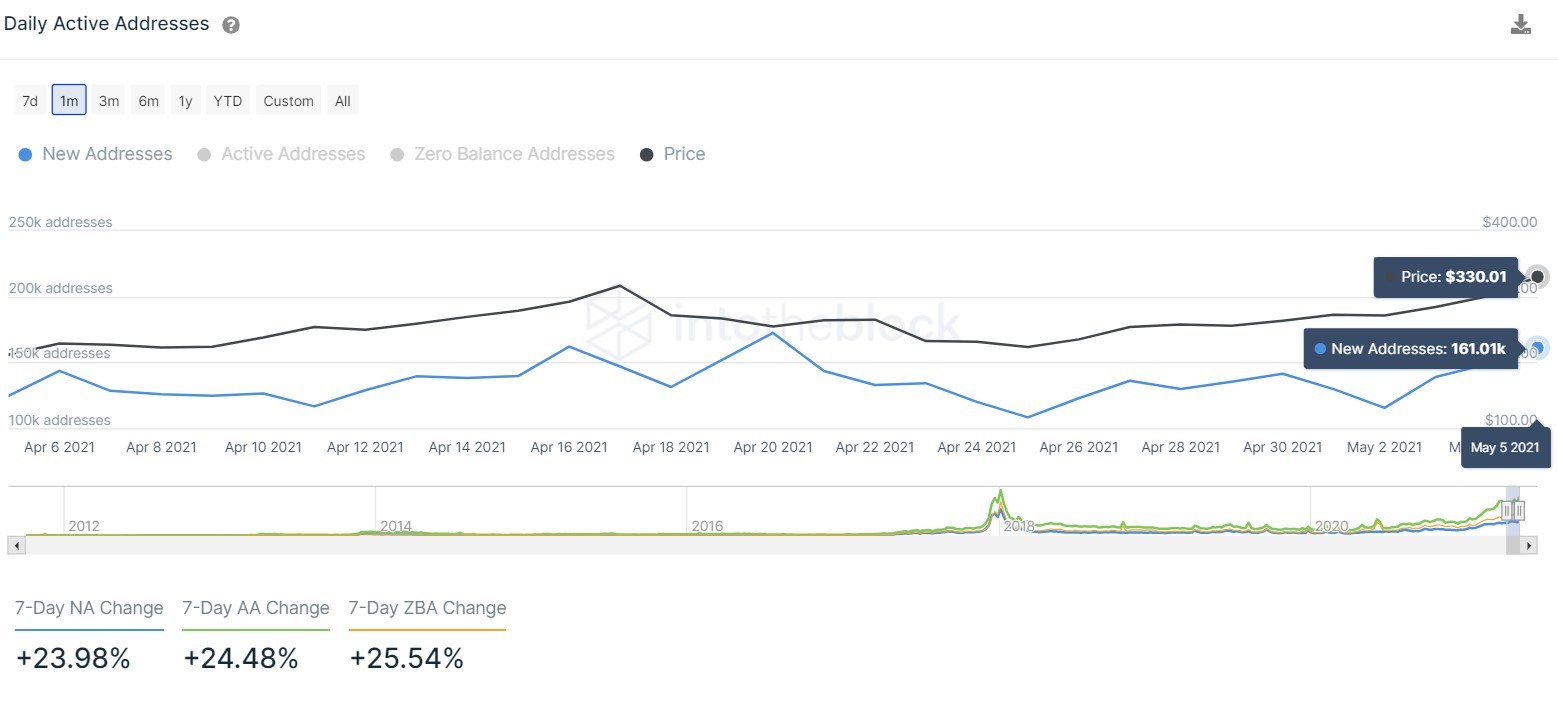
LTC daily new addresses chart
The number of transactions worth $100,000 or more can be used as a proxy for institutions’ investment interest. A sudden spike in this metric before a price surge could paint a bullish picture. However, an uptick in this metric often coincides with local tops.
With Litecoin price undergoing a minor retracement, the number of large transactions has increased by 50% since May 2. This divergence suggests that high-net-worth individuals might be accumulating LTC.
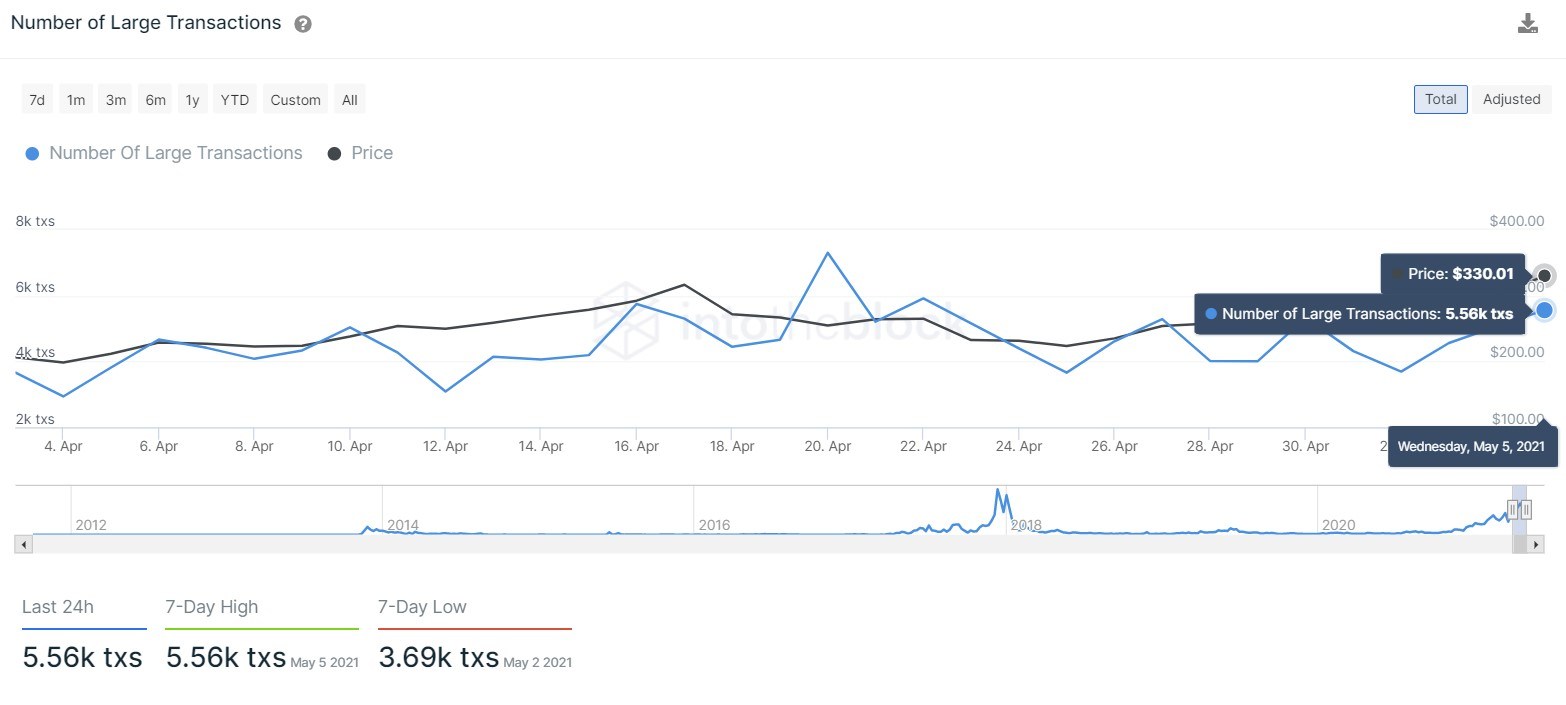
LTC large transaction count chart
While tagging the all-time high at $420 seems inevitable, a potential spike in selling pressure that shatters the weekly demand zone’s lower boundary at $217 will invalidate the bullish thesis. Such a move will kick-start a 15% downtrend to $185.46.
Author

Akash Girimath
FXStreet
Akash Girimath is a Mechanical Engineer interested in the chaos of the financial markets. Trying to make sense of this convoluted yet fascinating space, he switched his engineering job to become a crypto reporter and analyst.