Litecoin Price Prediction: LTC advance may halt near this stiff resistance barrier
- Litecoin price rally shows a consolidation in an ascending parallel channel for nearly four months.
- The supply barrier ranging from $296 to $317 could put an end to the upswing.
- LTC could retrace 10% if it gets rejected by the area of resistance mentioned above.

Litecoin price is approaching a critical level that could decide its trend for the foreseeable future.
Litecoin price to run into blockade
On the 1-day chart, Litecoin price is traversing an ascending parallel channel, which is obtained by connecting the trend lines to the multiple higher highs and higher lows set up since January 2021.
So far, the entire bull run for LTC seems to be encapsulated in this technical formation as it heads toward the upper trend line. However, a 6-hour supply zone that extends from $296 to $317 stands in its way.
A rejection at this resistance barrier could send LTC in a 15% downswing to $247.
Since the ascending parallel channel’s lower trend line is present above the demand zone, a bounce could trigger beforehand.
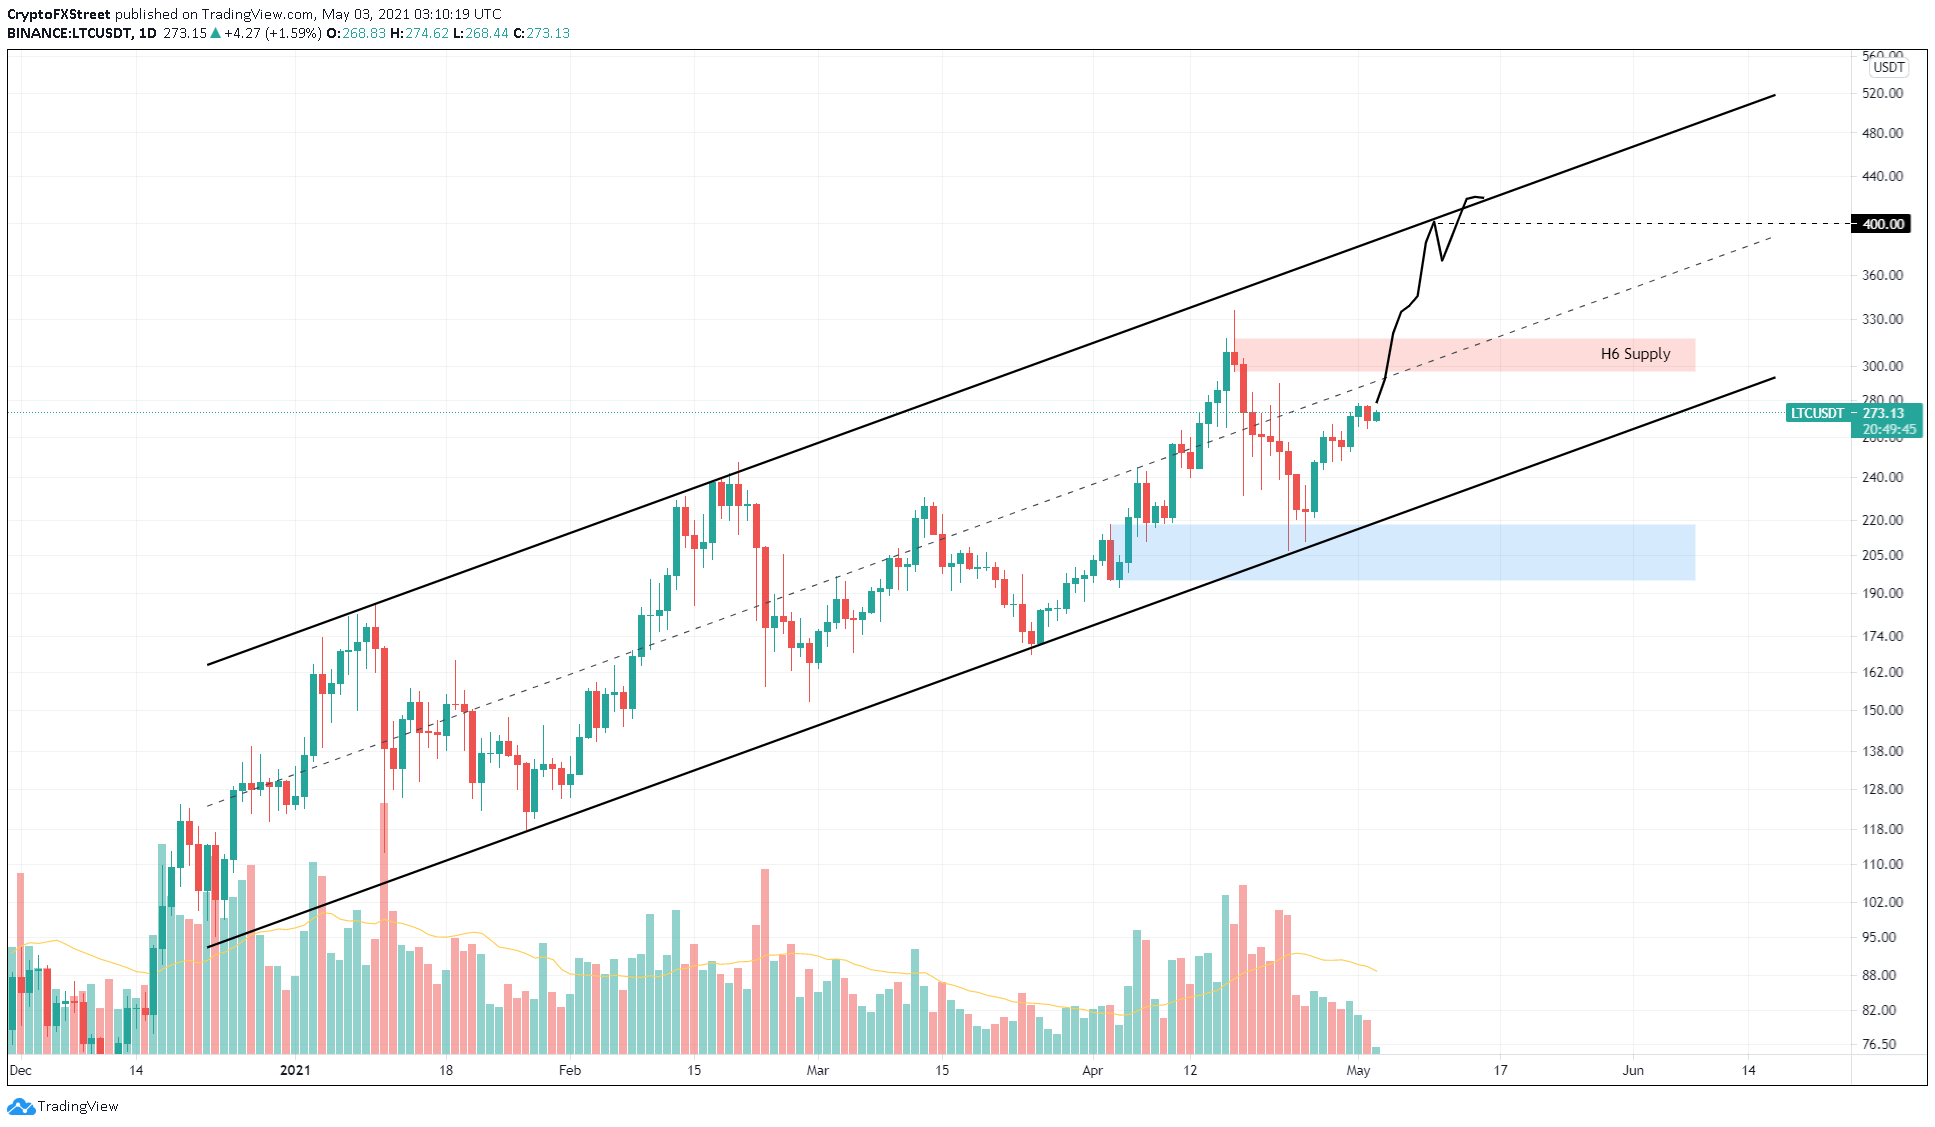
LTC/USDT 1-day chart
Supporting a rejection at the aforementioned resistance zone is IntoTheBlock’s Global In/Out of the Money (GIOM) model, which shows a cluster of underwater investors at $310. Here, roughly 94,500 addresses that purchased 845,000 LTC are “Out of the Money.” Therefore, Litecoin price could face additional sell pressure from investors who might want to break even.
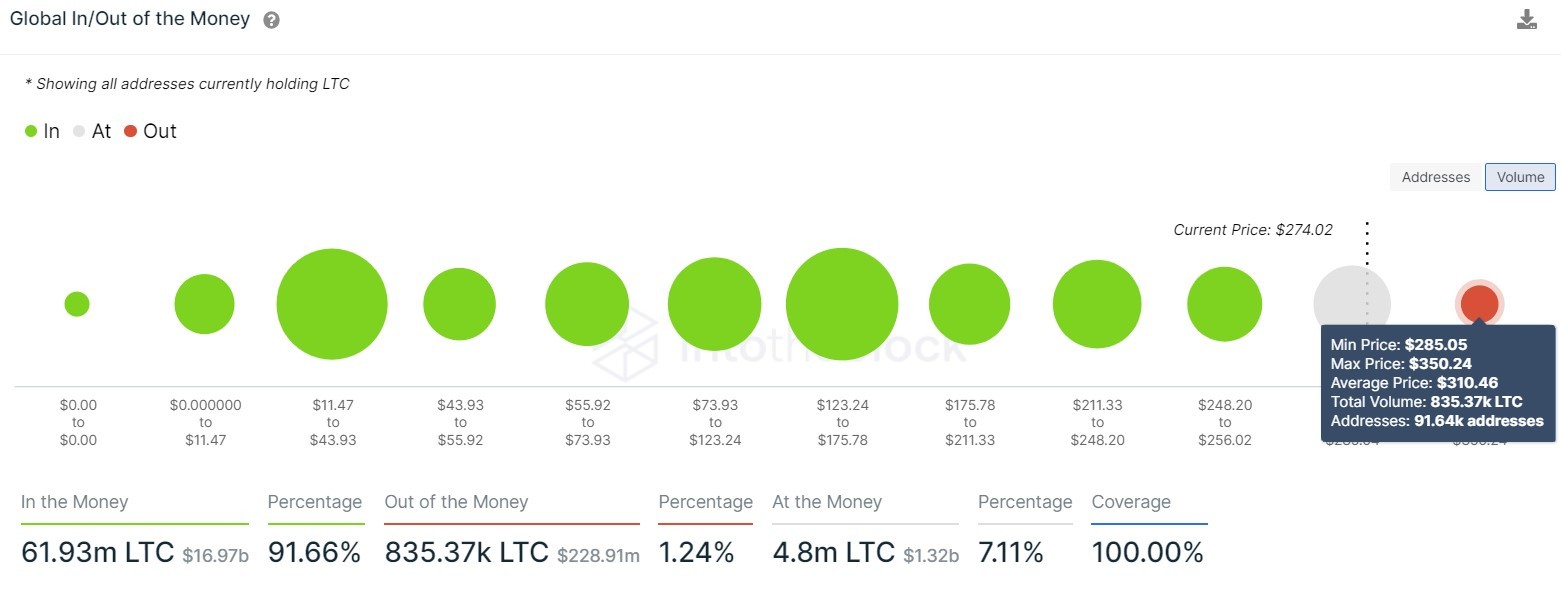
LTC GIOM chart
Furthermore, the 30-day MVRV model, which tracks the profit/loss of the LTC investors who purchased LTC over the past month, shows that it is approaching a local top at 13%.
At the time of writing, this metric reveals that about 10% of market participants are in profit. However, the last three times the MVRV approached 13%, LTC suffered a pullback.
Therefore, a similar turn of events could see LTC correct to the immediate demand barrier.
%20[08.19.41,%2003%20May,%202021]-637556082930629678.png)
LTC 30-day MVRV chart
While the technicals and on-chain metrics are both portraying a rejection, a potential spike in buying pressure that pushes Litecoin price to produce a decisive close above $317 will invalidate the bearish outlook.
Additionally, this would flip the underwater investors into profit and signal a continuation of bullish momentum to local highs at $335.69.
A further pile-up of bid orders could see this cryptocurrency climb to $400 and tap the upper trend line of the ascending parallel channel.
Author

Akash Girimath
FXStreet
Akash Girimath is a Mechanical Engineer interested in the chaos of the financial markets. Trying to make sense of this convoluted yet fascinating space, he switched his engineering job to become a crypto reporter and analyst.



