Litecoin price analysis: Short term plus long term equals breakout?
- LTC bounce off short term support.
- Nears long term resistance line.

Litecoin, after taking support on the short term charts in the last 2 days has managed to bounce smartly, reaching a critical resistance point on the long term chart, which if crossed and sustained, can lead to a long term trend change for this crypto.
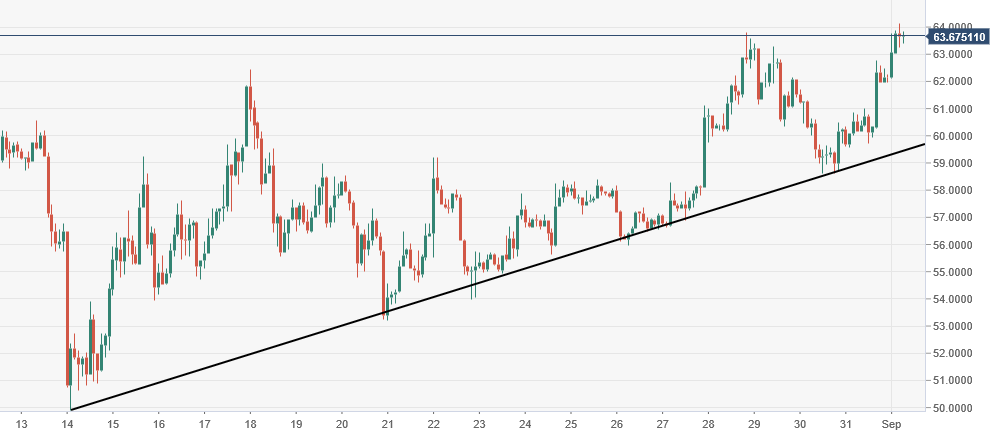
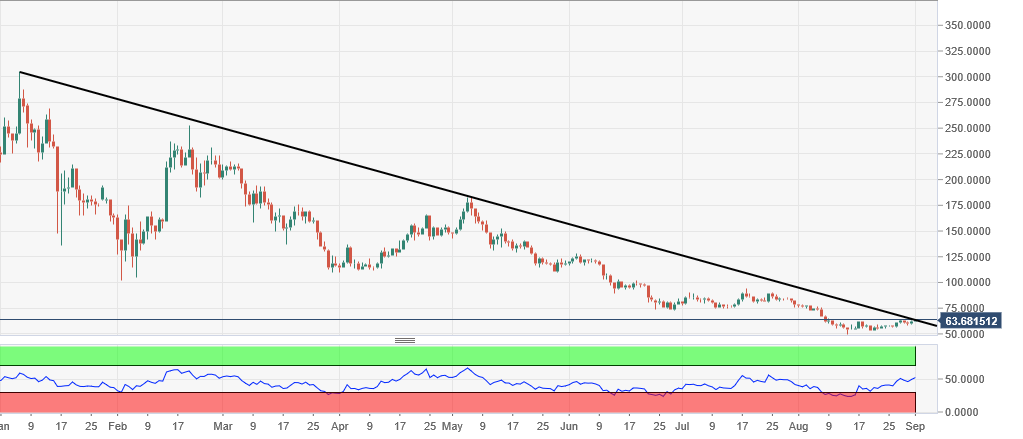
LTC/USD is up nearly 3 percent in the weekend trading at $63.766, retracing a bit from day's high of $64.121. A picture beautiful seems to be emerging on the 120-minute chart, wherein LTC has bounced from a critical ascending trendline support and now reached a long term zone where it needs some fresh momentum to take it past this long term trendline resistance that didn't allow it sustain any higher level since January this year.
That long term trendline resistance stands at $64-65 currently and breakout would be confirmed if its sustains past the zone of $75-85.
LTC/USD 120-minute chart:
LTC/USD daily chart:
Get 24/7 Crypto updates in our social media channels: Give us a follow at @FXSCrypto and our FXStreet Crypto Trading Telegram channel
Author

Manoj B Rawal
Independent Analyst
Manoj B Rawal, financial markets professional with about 11 years of experience in writing, editing and advising on stocks, currencies and fixed income.


