|

Litecoin Price Analysis: LTC/USD struggling with a barrier at the $72.50 mark

  • Litecoin price is trading in negative territory by 2.25% in the session on Tuesday. 
  • LTC/USD has been cooling for three sessions now. 
  • There is much in the way of resistance in the early $70 price territory via the daily.  
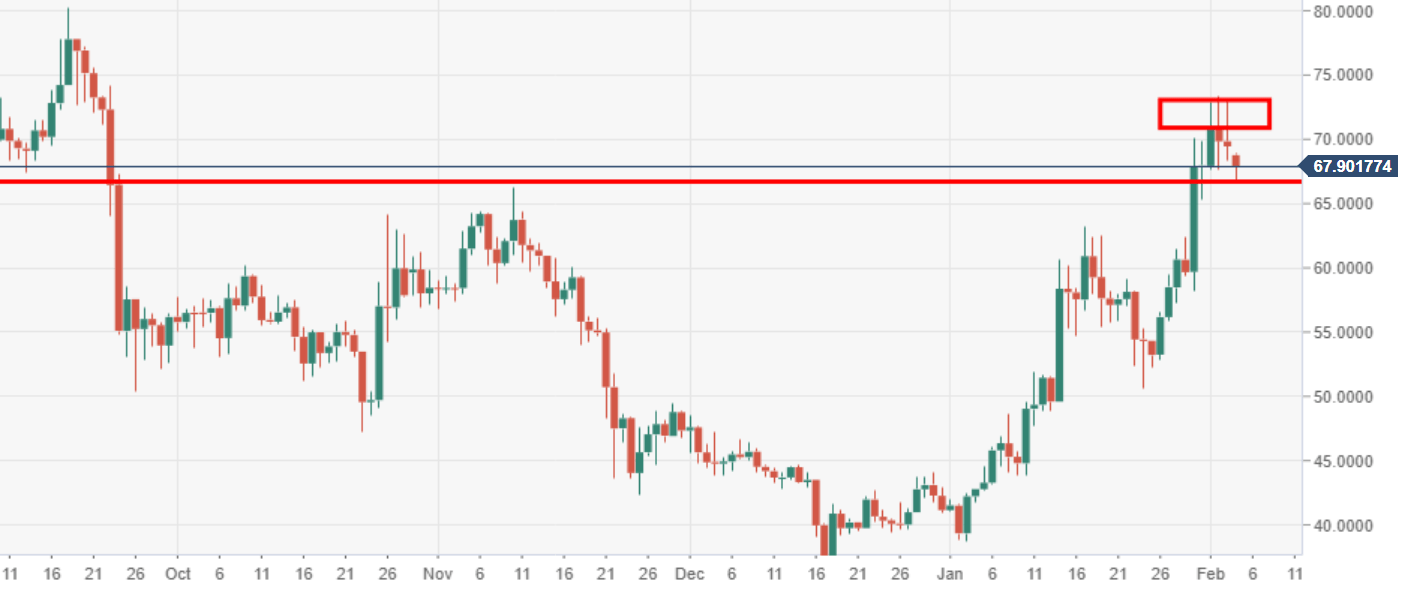
LTC/USD daily chart

The price was stuck within a bearish market structure, where lower highs were being produced. The prior high area was seen at around $65, which the bulls have managed to produce a weekly closure above. 

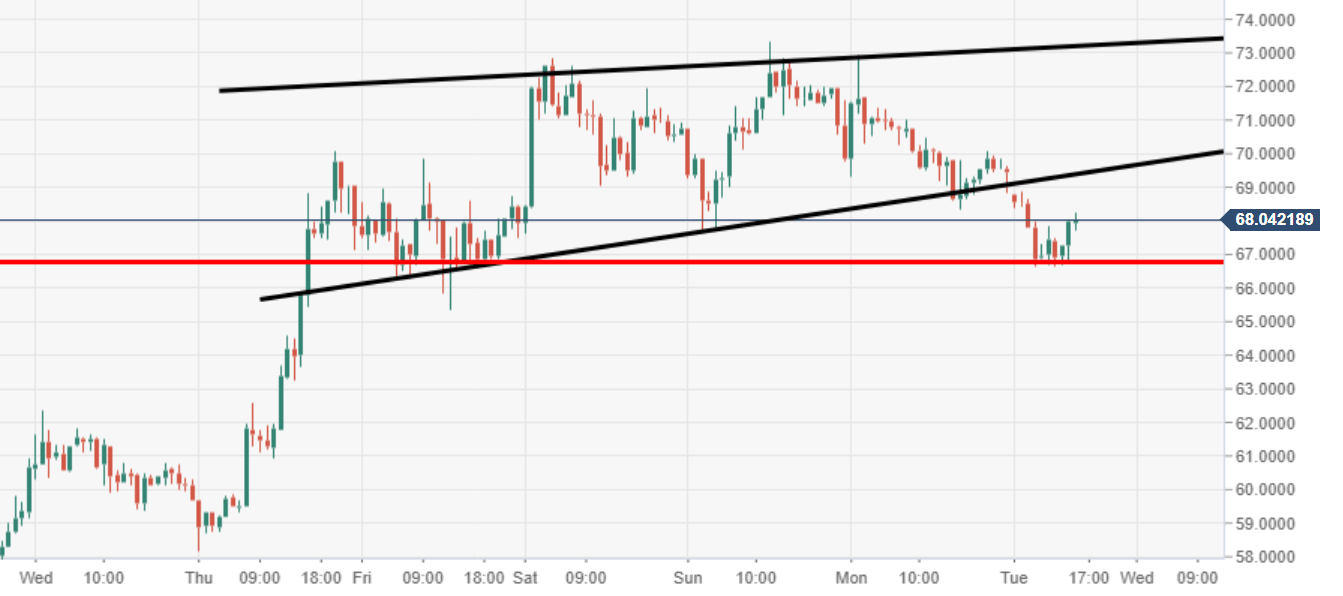
LTC/USD 60-minute chart

Critical 60-minute support should be noted at $66, failure to hold could invite another wave of selling pressure. 

Spot rate:                69.85

Relative change:    -2.25%

High:                        68.89

Low:                         66.62

LTC/USD

Overview
Today last price68.1929
Today Daily Change-1.2623
Today Daily Change %-1.82
Today daily open69.4552
 
Trends
Daily SMA2060.4541
Daily SMA5050.1857
Daily SMA10051.4643
Daily SMA20062.0045
 
Levels
Previous Daily High72.9511
Previous Daily Low68.3271
Previous Weekly High70.0854
Previous Weekly Low52.8193
Previous Monthly High70.0854
Previous Monthly Low38.7677
Daily Fibonacci 38.2%70.0934
Daily Fibonacci 61.8%71.1847
Daily Pivot Point S167.5379
Daily Pivot Point S265.6205
Daily Pivot Point S362.9139
Daily Pivot Point R172.1618
Daily Pivot Point R274.8684
Daily Pivot Point R376.7858

Author

Ken Chigbo

Ken Chigbo

Independent Analyst

Ken has over 8 years exposure to the financial markets. He started his career as an analyst, covering a variety of asset classes; forex, fixed income, commodities and equities.

More from Ken Chigbo
Share:

Editor's Picks

Ripple extends losses as derivatives interest cools

Ripple (XRP) extends its bearish roll near $1.12 support on Friday, reflecting intense headwinds in the broader crypto market largely attributable to macroeconomic pressure.

Crypto Today: Bitcoin, Ethereum, XRP weaken further as capital outflows persist

Macroeconomic headwinds continue to weigh heavily on the cryptocurrency market on Friday, prompting major assets like Bitcoin (BTC) to pare earlier gains and extend losses after June’s brief relief rally.

Bitcoin Weekly Forecast: Recovery hopes fade after the Fed spoils the party

Bitcoin is set to end the week in the red, trading near the 200-Week Simple Moving Average at around $62,300 on Friday. Institutional selling persists, capping BTC’s recovery as spot Exchange Traded Funds point to a sixth consecutive week of outflows.

Sui risks a deeper bearish leg despite on-chain resilience

Sui is down 2% on Friday, extending its decline toward the recent support leg formed at $0.6618. The Total Value Locked in the Sui ecosystem has stabilized around 600 million SUI tokens, reflecting resilient user demand.

Bitcoin: Recovery hopes fade after the Fed spoils the party
Bitcoin (BTC) is set to end the week in the red, trading near the 200-Week Simple Moving Average (SMA) at around $62,300 on Friday. Institutional selling persists, capping BTC’s recovery as spot Exchange Traded Funds (ETFs) point to a sixth consecutive week of outflows.