|

Litecoin Price Analysis: LTC/USD gunning for another critical retest of breached flag

  • Litecoin price is trading in positive territory by 3.35 % in the session on Wednesday. 
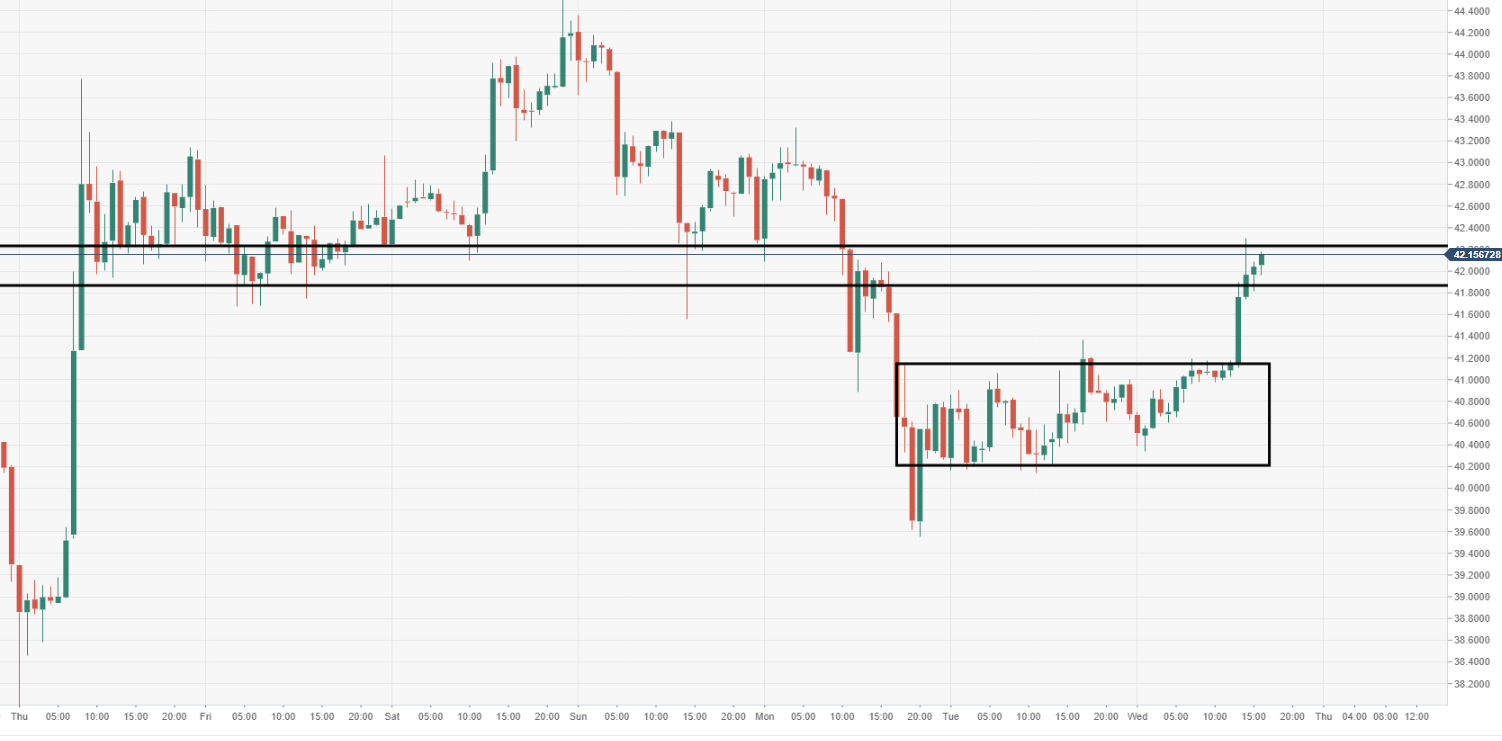
  • LTC/USD is moving within a narrowing range block structure, explosive breakout eyed. 
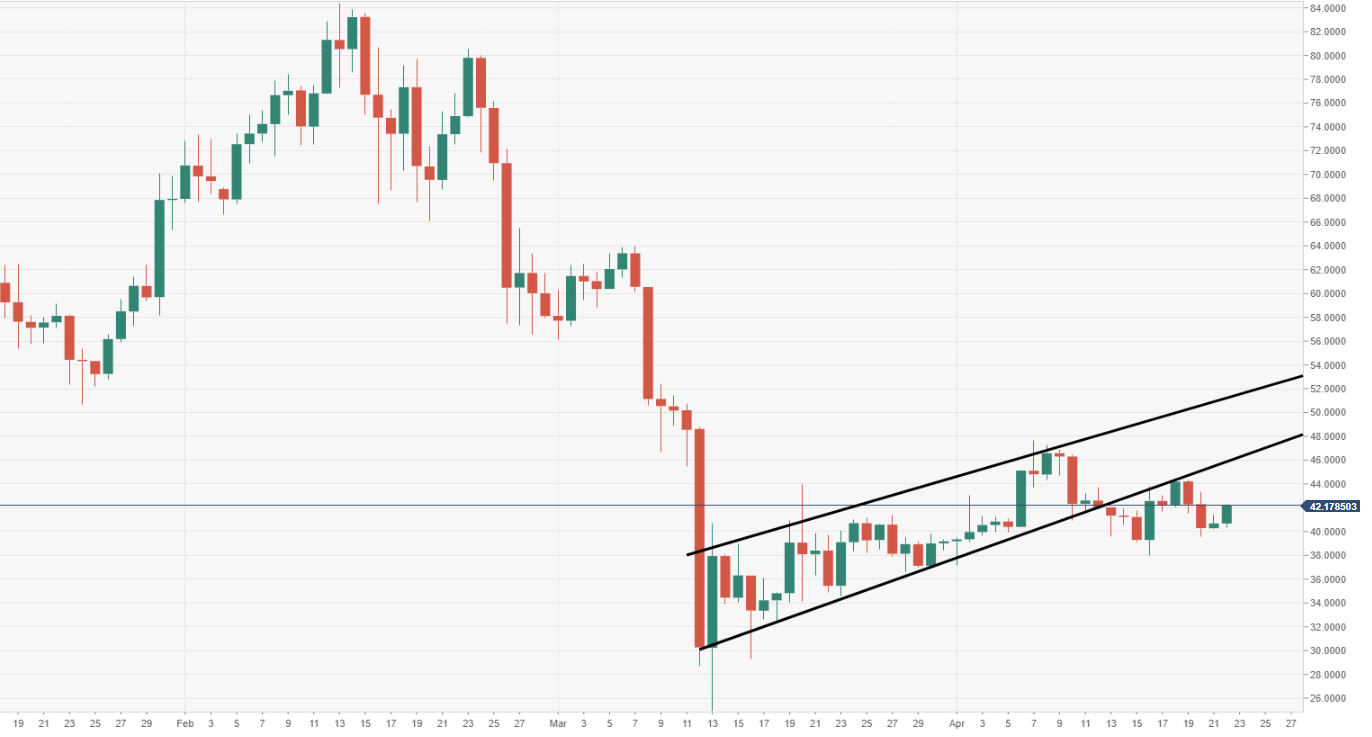
  • Following a daily bear flag breakout, vulnerabilities have remained tilted to the downside. 

LTC/USD daily chart

The bulls are pushing for a retest of the breached flag pattern, following a strong break above $40, which was proving to be a stubborn near-term barrier. A closure back above the noted structure will need to be seen, in order to void the potential bear set-up. 
LTC/USD 60-minute chart

Price action has smashed to the upside out from a narrowing range-block formation, inviting a fresh wave of buying pressure. 
Spot rate:               40.17

Relative change:  +3.35%

High:                      42.30

Low:                       40.34

LTC/USD

Overview
Today last price42.0605
Today Daily Change1.3793
Today Daily Change %3.39
Today daily open40.6812
 
Trends
Daily SMA2042.2807
Daily SMA5042.742
Daily SMA10054.6854
Daily SMA20052.5541
 
Levels
Previous Daily High41.3634
Previous Daily Low40.1414
Previous Weekly High43.767
Previous Weekly Low37.9812
Previous Monthly High63.9927
Previous Monthly Low24.9467
Daily Fibonacci 38.2%40.8966
Daily Fibonacci 61.8%40.6082
Daily Pivot Point S140.0939
Daily Pivot Point S239.5066
Daily Pivot Point S338.8719
Daily Pivot Point R141.3159
Daily Pivot Point R241.9507
Daily Pivot Point R342.538

Author

Ken Chigbo

Ken Chigbo

Independent Analyst

Ken has over 8 years exposure to the financial markets. He started his career as an analyst, covering a variety of asset classes; forex, fixed income, commodities and equities.

More from Ken Chigbo

Share:

Editor's Picks

Pepe Price Forecast: PEPE signals trend reversal amid a short squeeze

Pepe price is up nearly 30% in the last 24 hours, outperforming most top cryptocurrencies and hinting at further upside potential. Derivatives data suggest a short squeeze of more than $2 million during the same period, forcing traders to buy back positions in the meme coin. The technical outlook for PEPE indicates an upside bias as bullish momentum strengthens.

Crypto Overview: Bitcoin tops $85,000 post-CLARITY Act failure – TAO and FET lead gains

Bitcoin price trades above $85,000 maintaining a constructive tone amid positive institutional inflows, Strategy’s first BTC purchase since August, and alternative regulatory expansions following the CLARITY Act's failure. AI tokens such as Bittensor (TAO) and FET have emerged as top performers over the last 24 hours.

Ripple and Stellar outlook: Momentum improves as bulls target further gains

Ripple (XRP) and Stellar (XLM) stabilize after extending their gains by nearly 9% at the start of the week. Improving momentum indicators support XRP and XLM bullish price action and hint at further rally. Meanwhile, traders should remain cautious as mixed derivatives data could limit upside as both tokens try to sustain their recent upswing.

Ethereum Price Forecast: ETH rallies above $2,700 as investors shrug off bearish sentiment

Ethereum climbed above $2,700 on Monday after investors defended the realized price level despite negative sentiment over the Clarity Act's failure and the Federal Reserve rate hike. After the Clarity Act failed to advance in the Senate, ETH dipped below $2,400 last week. But right below that price is the top altcoin's realized price, or average on-chain cost basis, at $2,310.

Bitcoin: BTC shrugs off CLARITY Act setback and hawkish Fed
Bitcoin (BTC) price action has remained resilient this week, trading above $78,000 at the time of writing on Friday, heading toward a key resistance zone. Institutional demand shows early signs of weakness, with spot Exchange Traded Funds (ETFs) on track for a second straight week of outflows, with over $420 million recorded through Thursday amid escalating Middle East tensions.