Litecoin presents shorting opportunity before LTC hist $70
- Litecoin price action is forming one of the most sought-after bearish chart patterns in technical analysis.
- Lower lows continue to be the norm for LTC.
- One final support zone for Litecoin price is present at $103, but participation and buying are weak.

Litecoin price has some of the most persistent and bearish activity out of all the major cryptocurrencies. From the all-time high of $414 on May 10, 2021, to the current major swing low of $92 found on February 24, 2022, Litecoin has lost $321 or almost 80% of its value. If the market were to rate which cryptocurrencies are leaders at losing, Litecoin would be light years ahead of most of the market.
Litecoin price to continue south, little evidence of any buying support before a significant sell-off ensues
Litecoin price is inside of the most sought-after bearish continuation patterns in technical analysis: the descending triangle. Whether the descending triangle appears at the top or the bottom of the market, it is universally and statistically viewed as an extremely bearish pattern. Moreover, regarding its performance as a bearish pattern, it is second only to the rising wedge pattern in strength.
With any triangle pattern, there is some common (but not required) behavior associated with triangles:
- Breakouts often occur within the final 1/3rd of the pattern.
- Volume drops off before the breakout.
- Pullbacks to retest the break of the triangle frequently happen (between 40% - 60% of the time).
For Litecoin price, the final support level holding LTC up is the Tenkan-Sen and bottom of the descending triangle at $103. If $103 fails as support, the next target bears will likely push LTC before covering the 100% Fibonacci expansion at $70.
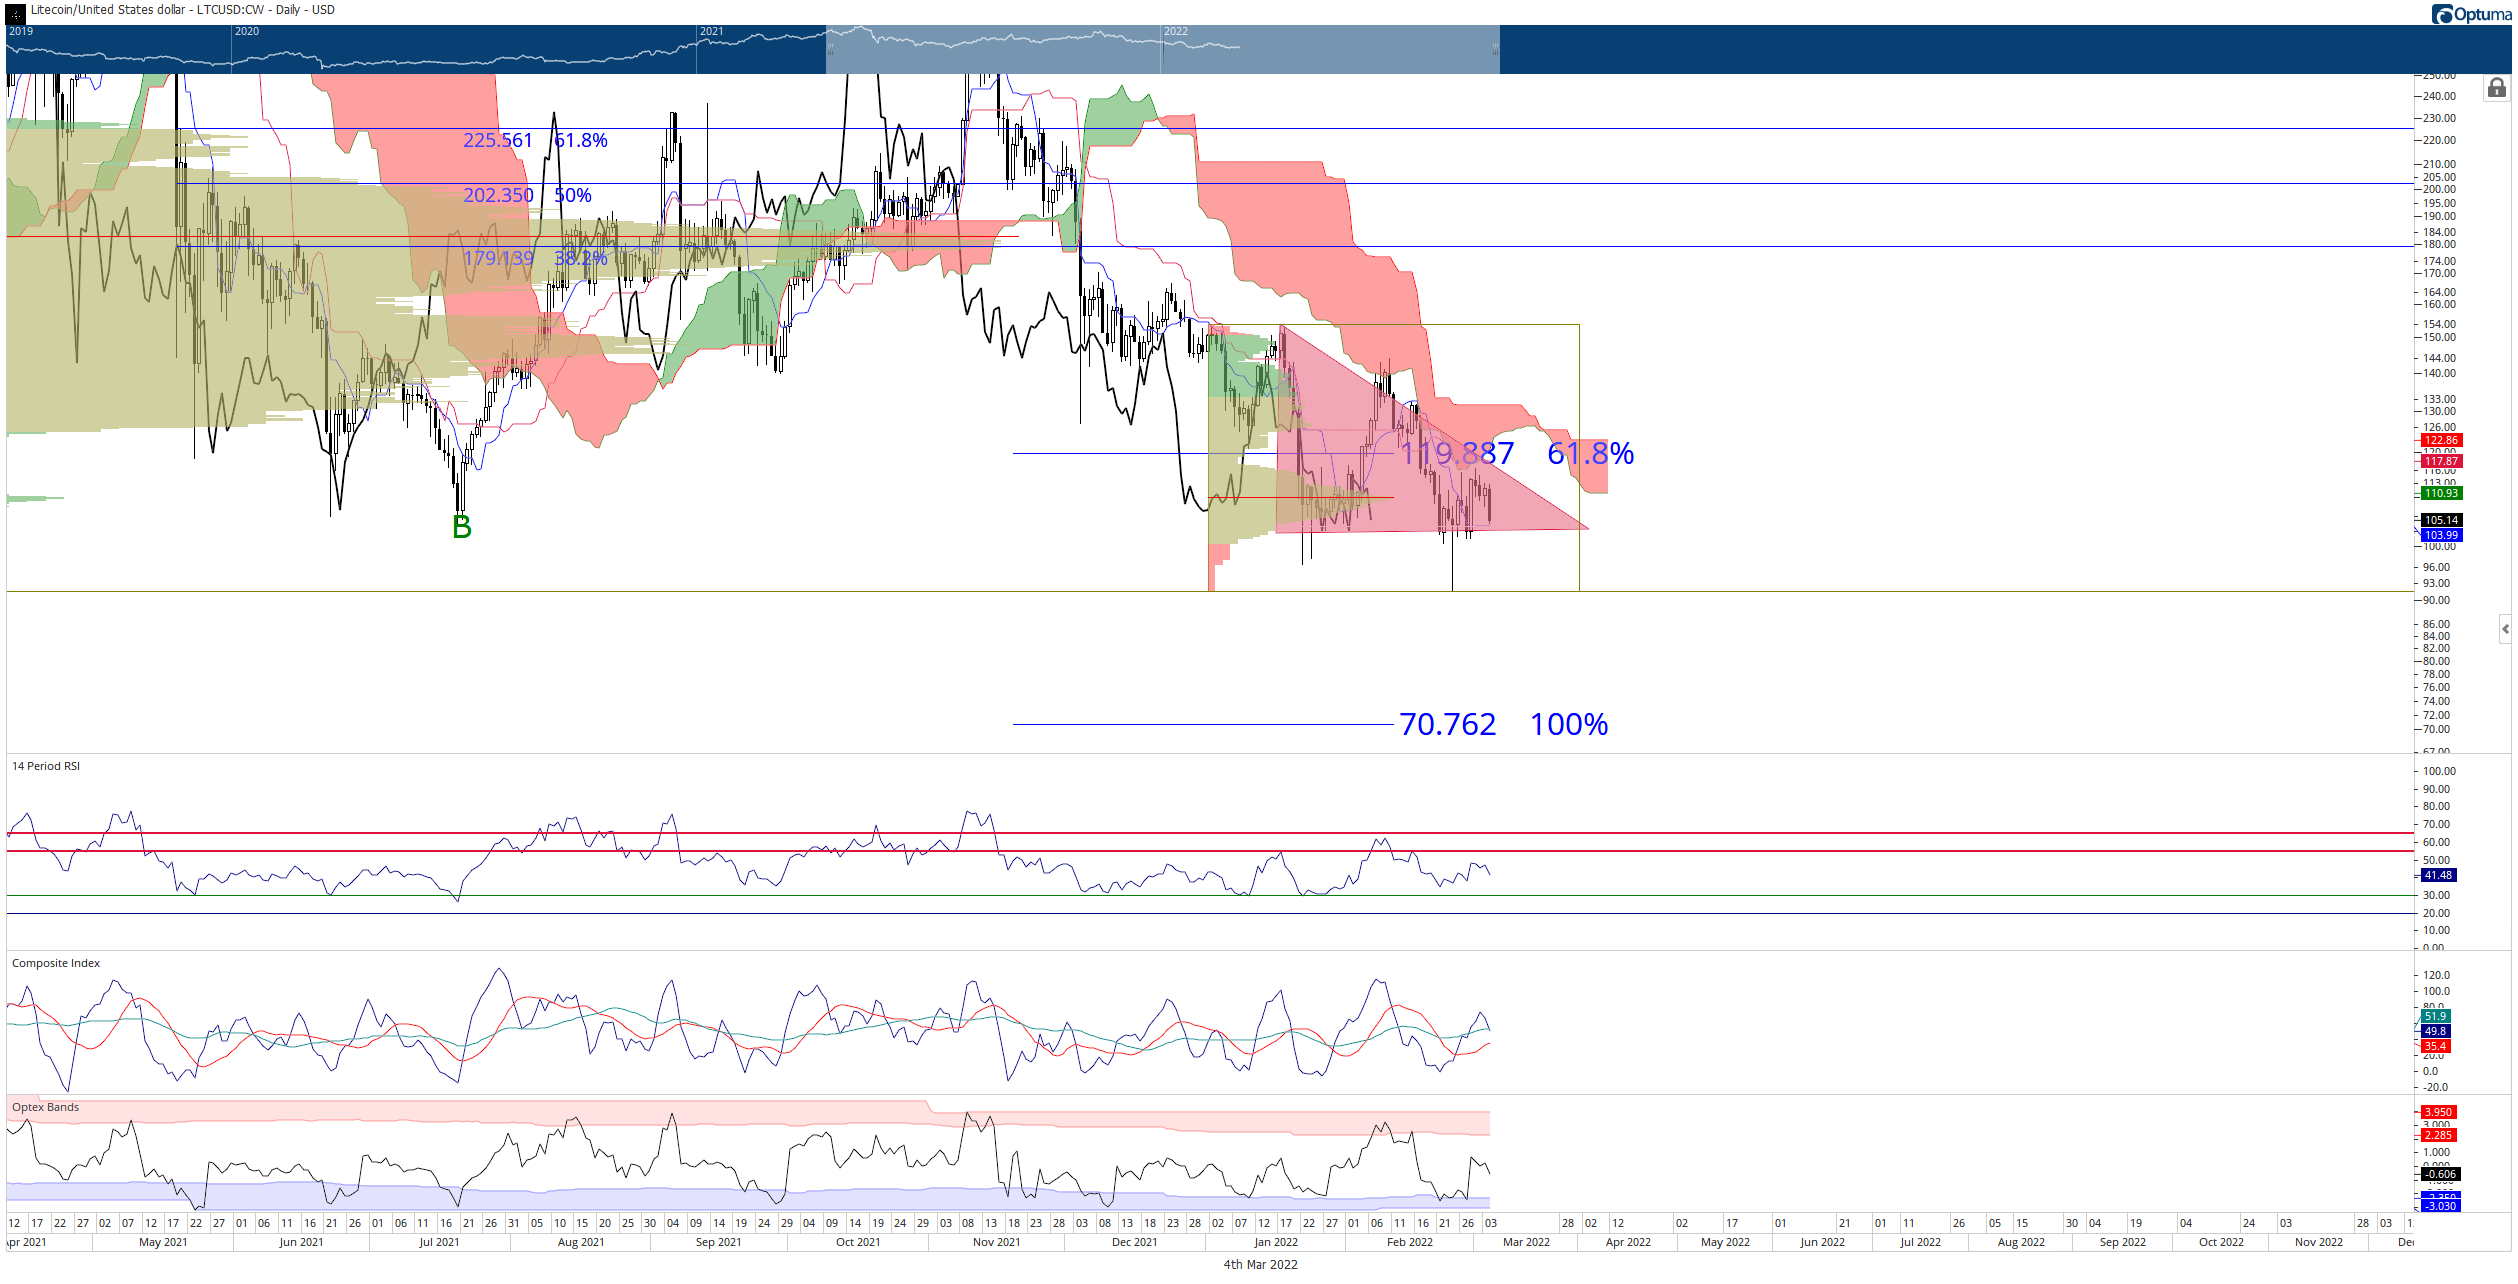
LTC/USD Daily Ichimoku Kinko Hyo Chart
For bulls to mitigate any near-term selling pressure, at a minimum, they’ll need to return Litecoin price to a close inside the Ichimoku Cloud. Buyers can invalidate any short bias by closing Litecoin above the Ichimoku Cloud at or above $132.50, triggering an Ideal Bullish Ichimoku Breakout.
Author

Jonathan Morgan
Independent Analyst
Jonathan has been working as an Independent future, forex, and cryptocurrency trader and analyst for 8 years. He also has been writing for the past 5 years.



