- Litecoin network may undergo soft fork at the same time with Bitcoin
- LTC/USD recovery is limited by a psychological barrier of $60.00.
Litecoin, the 7th largest digital coin with the current market value of $3.6 billion, has stayed mostly unchanged in recent 24 hours. At the time of writing, LTC/USD is changing hands at $57.25, off the recent high registered at $63.17 on January 17.
The coin has been range-bound with a bearish bias, moving in sync with the market. Litecoin's price movements are affected mostly by speculative sentiments and technical factors.
Litecoin's soft fork is coming
Litecoin community on Reddit has been discussing the possibility of Litecoin soft fork with the aim to activate 'Schnorr-Taproot' upgrade together with Bitcoin. The roll-out of Schnorr signatures and Taproot schemes may enhance Litecoin security and scalability. Also, Schnorr/Taproot upgrade will allow for new multi-signature solutions
The Reddit user Losh11 believes that neither Bitcoin nor Litecoin will have issues with implementing these upgrades.
Personally I don't think there will be any issues with Bitcoin activating Schnorr/Taproot. We will likely activate Schnorr/Taproot at a similar time.
According to cryptocurrency analyst Lucas Nuzzi, the upgrade may soft-fork the Bitcoin network in 2020.
LTC/USD: technical picture
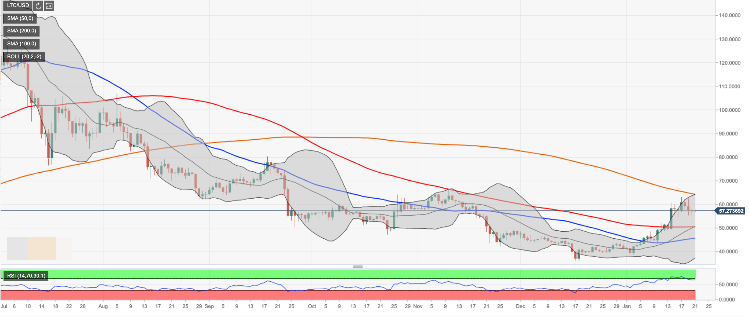
LTC/USD topped at $63.17 on January 17, however, the bulls failed to hold the ground. The coin slipped back below $60.00 level to trade at $57.25 at the time of writing. The local support is created by psychological $57.00, while the next bearish target comes at $50.50. This area is reinforced by a combination of SMA100 daily and the middle line of the daily Bollinger Band. Once it is broken, the sell-off may be extended towards $50.00 and $45.70 (SMA50 daily). This area is likely to serve as a strong hurdle for the sellers and create an incentive for recovery.
On the upside, the initial resistance is created by the middle line of the 4-hour Bollinger Band at $59.00. A sustainable move above this area is needed to retest $60.00 and move to the recent high of $63.17. The ultimate bulls' goal is created by SMA200 daily and the upper line of the daily Bollinger Band at $64.24.
LTC/USD daily chart
Note: All information on this page is subject to change. The use of this website constitutes acceptance of our user agreement. Please read our privacy policy and legal disclaimer. Opinions expressed at FXstreet.com are those of the individual authors and do not necessarily represent the opinion of FXstreet.com or its management. Risk Disclosure: Trading foreign exchange on margin carries a high level of risk, and may not be suitable for all investors. The high degree of leverage can work against you as well as for you. Before deciding to invest in foreign exchange you should carefully consider your investment objectives, level of experience, and risk appetite. The possibility exists that you could sustain a loss of some or all of your initial investment and therefore you should not invest money that you cannot afford to lose. You should be aware of all the risks associated with foreign exchange trading, and seek advice from an independent financial advisor if you have any doubts.
Recommended Content
Editors’ Picks
Ripple's move above this key level could trigger nearly 50% rally for XRP
Ripple has overcome a critical resistance level and flipped into a support floor on the weekly time frame. This development happened while XRP tightly consolidated for roughly 250 days. Investors can expect XRP to kickstart a massive rally.
Optimism price outlook with nearly $90 million worth of OP tokens flooding markets on Friday
Optimism volatility has shrunk in the ours leading to the network’s cliff unlock. It joins the likes of dYdX and Sui, which have similar events on their calendars. As token unlocks are often considered bearish catalysts, investors should brace for a reaction after the event.
Top 3 Price Prediction Bitcoin, Ethereum, Ripple: Retail watches from the sidelines with a bias for shorts
Bitcoin could clear $73,777 peak as BTC bulls resurface. Ethereum might fall 10% before next leg up as ETH RSI teases with sell signal. XRP could lose $0.6000 threshold as Ripple bulls fail to show up.
Jito price could hit $6 as JTO coils up inside this bullish pattern
Jito price action shows a potential cup and handle formation. Based on theoretical measurement rules, a successful breakout could yield a 56% rally to $6.0. A breakdown of the $3.86 support level would create a lower low for JTO and invalidate the bullish thesis.
Bitcoin: BTC may have recovered, but is it out of the woods?
Bitcoin’s (BTC) upward momentum has shown a significant decline for the past two weeks or so. This development led to a bearish signal on the weekly and an uncertain outlook on the monthly.