LINK takes second jab at bullish 37% breakout after a small dip
- Chainlink price is giving the bullish breakout another try after dipping back into the symmetrical triangle pattern.
- A decisive close above $30.31 shows the promise of a 37% upswing to $41.63
- Transactional data and whale activity suggest a massive breakout attempt shortly.
-637336005550289133.jpg)
The Chainlink price is showing signs of a bullish onslaught approaching soon.
Chainlink price on the verge of enormous upswing
The Chainlink price created several lower highs and higher lows since February 20. Trend lines drawn along these swing points showed LINK was consolidating in a symmetrical triangle pattern.
The breakout on April 2 propelled LINK by 7%, but overwhelming selling pressure pushed it back into this consolidation. At the time of writing, the oracle token was giving the bullish breakout another attempt.
To do so, the buyers need to push past the State Trend Resistance set up by the Momentum Reversal Indicator at $30.31, coinciding with the breakout point. This move will confirm the buyers’ objective and signal the start of a bullish run-up.
Adding credence to the upswing is the SuperTrend indicator’s buy signal that spawned after the move on April 2.
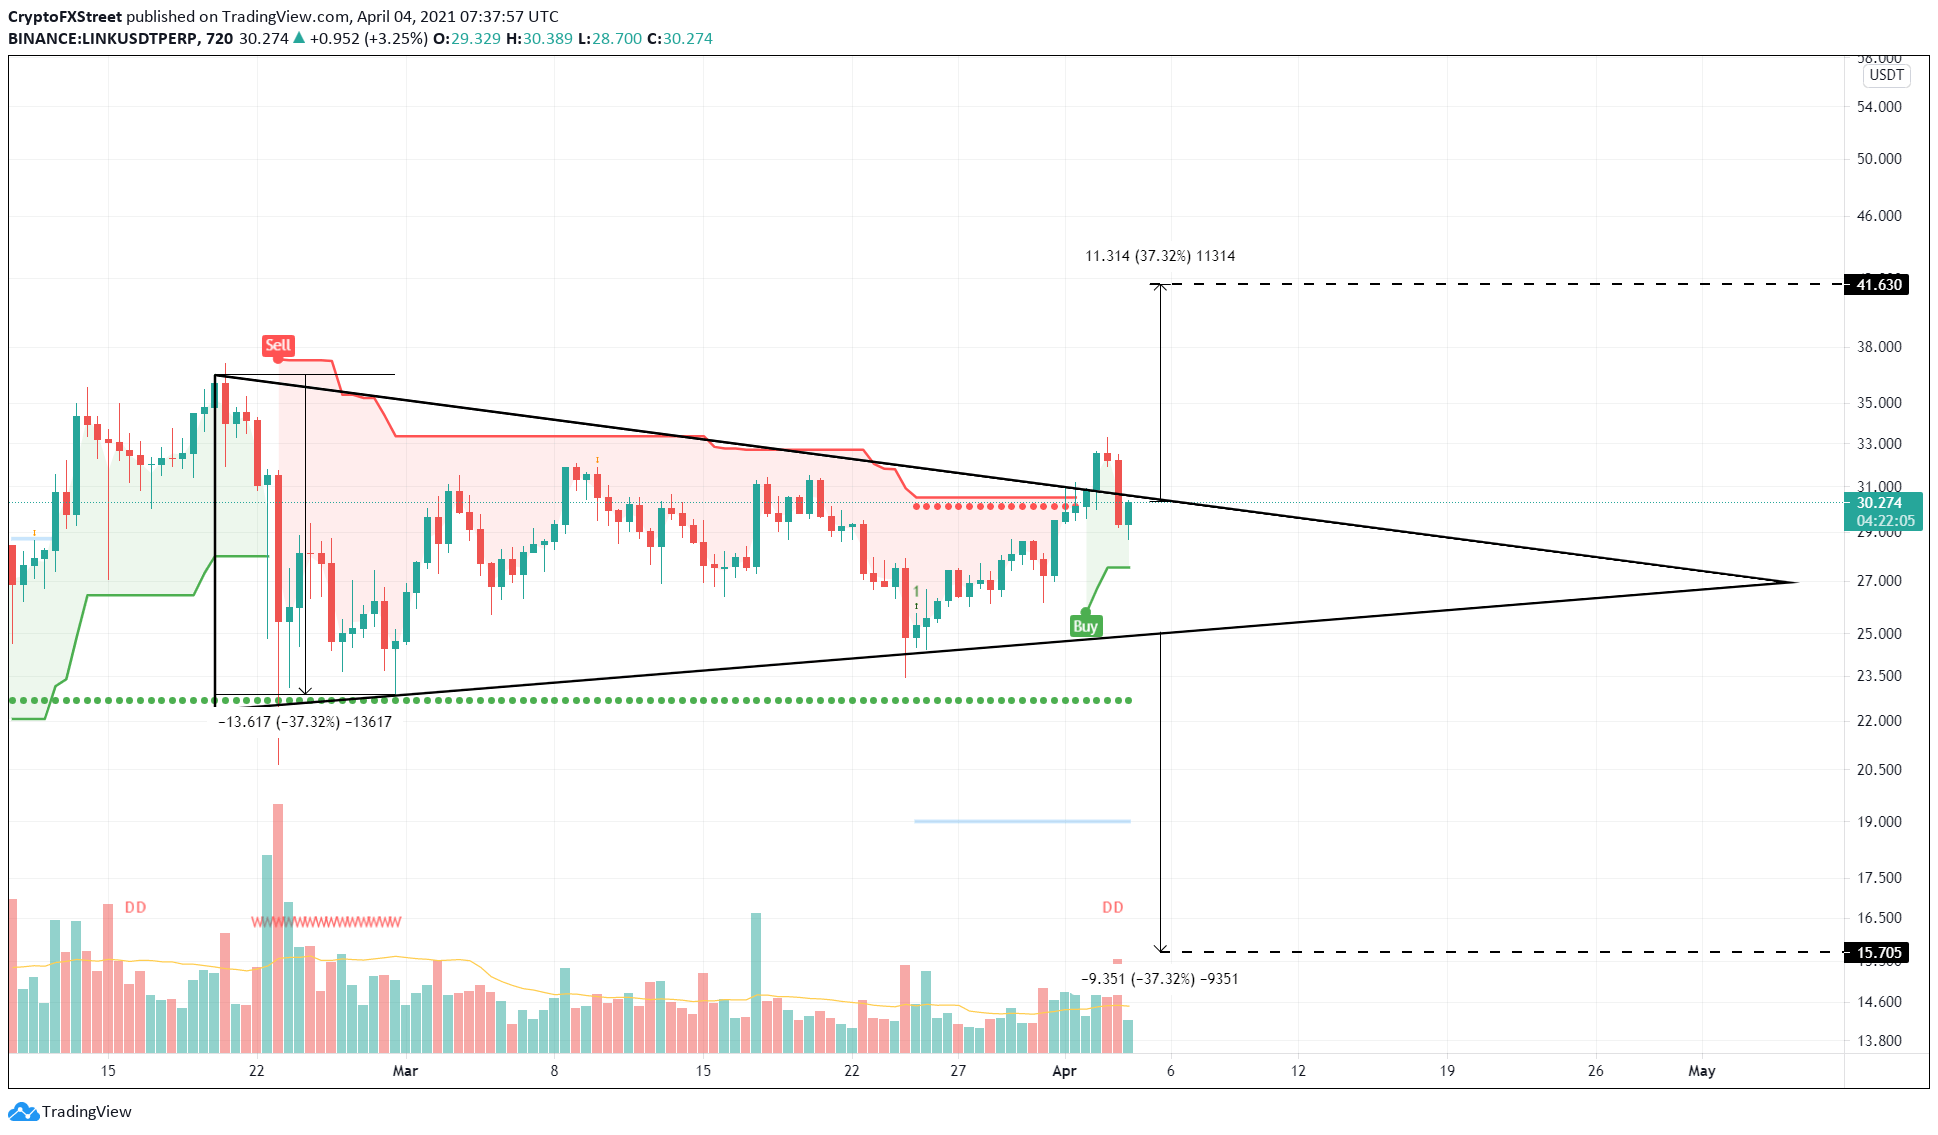
LINK/USDT 12-hour chart
Further providing a tailwind to the Chainlink price is the whale transaction count. This metric measures market participants’ transaction activity worth more than $100,000, and a spike could potentially represent their investment in LINK tokens.
The recent spike seen on April 2nd indicates the entry of such individuals and paints a bullish picture.
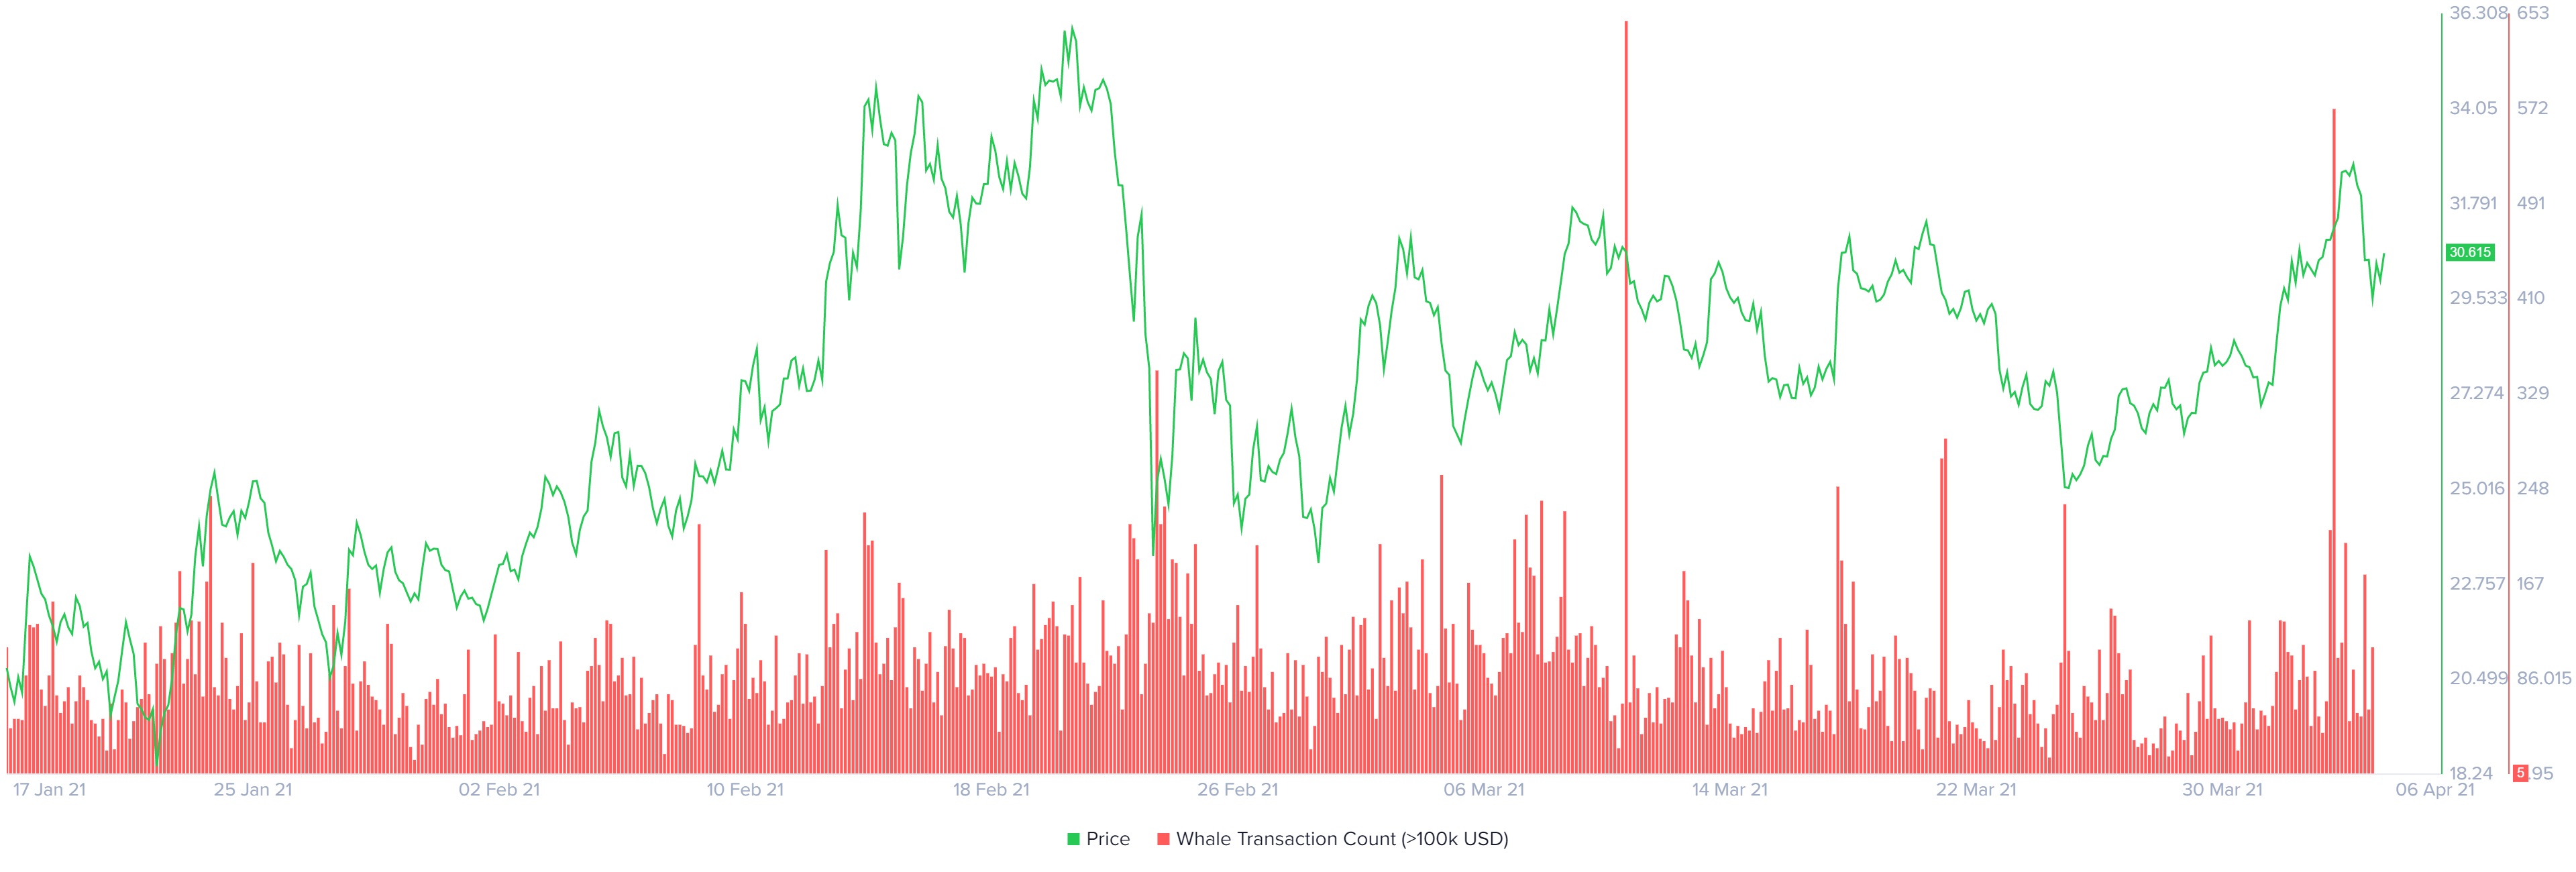
LINK whale transaction count chart
Additionally, the whales holding 100,000 to 1,000,000 LINK tokens indicate an interest in LINK at the current price levels. As a result, the number of such investors has increased 6% from 251 to 267 from April 1 to April 3.
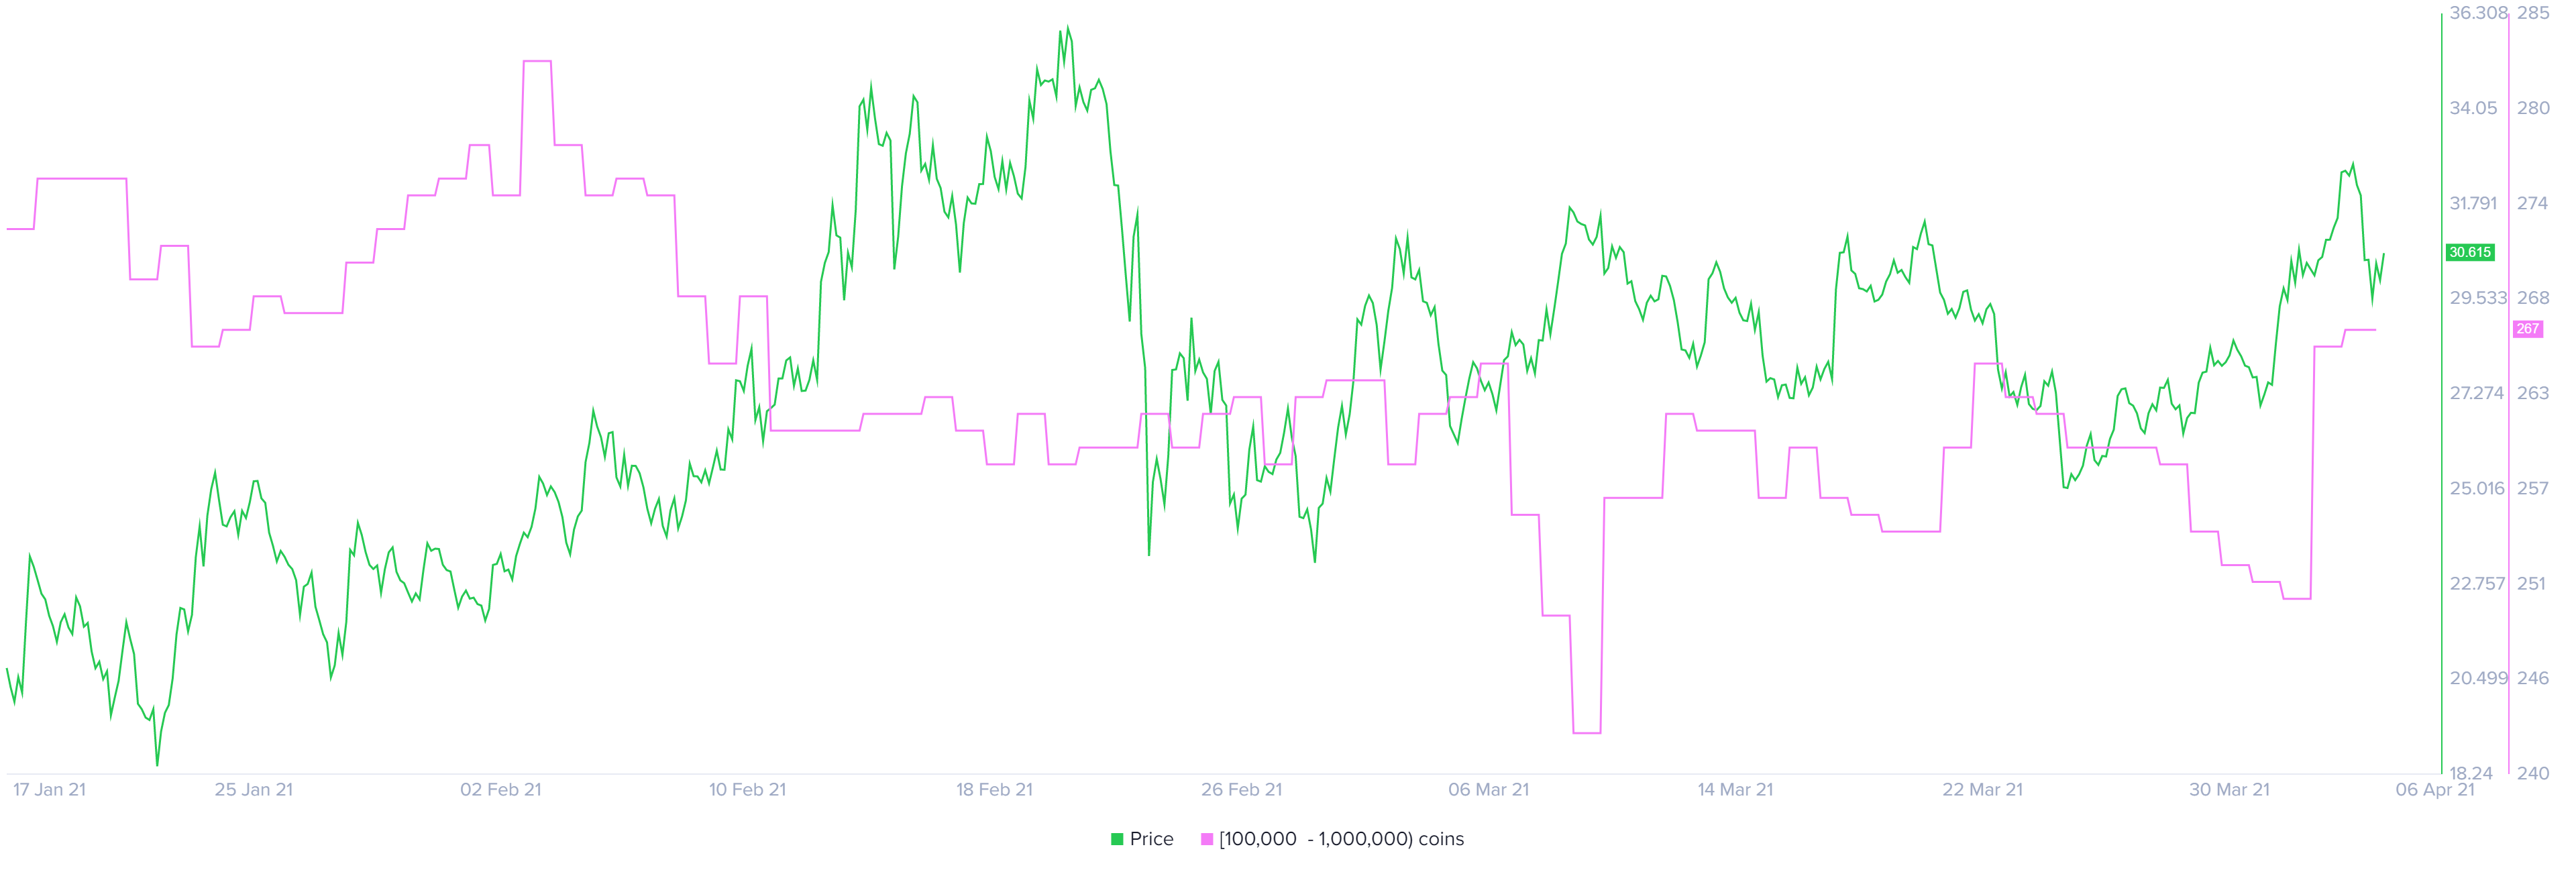
LINK whale holder distribution chart
While things seem to be looking up for the oracle token, a failure to rise above the upper trend line at $2.65 might signal weak buyers.
Such a scenario will soon result in a reversal in momentum, dragging the Chainlink price toward the immediate demand barrier at $28. Further persistence of selling momentum could result in a 10% downswing to the lower trend line at $25.03.
A breakdown of the symmetrical triangle’s lower boundary opens up the possibility for a 10% crash to the MRI’s State Trend Support at $22.64.
Author

Akash Girimath
FXStreet
Akash Girimath is a Mechanical Engineer interested in the chaos of the financial markets. Trying to make sense of this convoluted yet fascinating space, he switched his engineering job to become a crypto reporter and analyst.


