Chainlink price rebounding, but not a convincing commitment from traders
- Chainlink price collapse on March 22 broke significant support.
- Lack of buying intensity undermines credibility of the 20% rebound.
- Pivotal resistance above will determine price direction for the next 2-3 weeks.
-637336005550289133.jpg)
Chainlink price rebound is compromised by the down-trending 21-day simple moving average (SMA) at $28.41 and the flattening 50-day SMA at $29.03. A breakout above the confluence of moving averages requires a more outstanding commitment than daily volume running at less than half the average. For now, the 20% rebound over the last five days has to be viewed as a corrective process of the extreme oversold condition shown on the 4-hour chart on March 24.
Chainlink price follows the broader strength in the cryptocurrency complex
The tag-along advance is consistent with weaker cryptocurrencies. Still, with ample resistance just above the current price level, traders should be preparing for a reassertion of the selling to carry LINK to the 100-day SMA at $23.55, a trend-spotting indicator that has not been tested in the first days of 2021.
The February 23 crash low at $21.00 is compelling price support and will ignite a bounce, but a bearish outlook needs to entertain the August 2020 high at $20.00 as the final resting place for LINK, yielding a loss of 29% from today’s price.
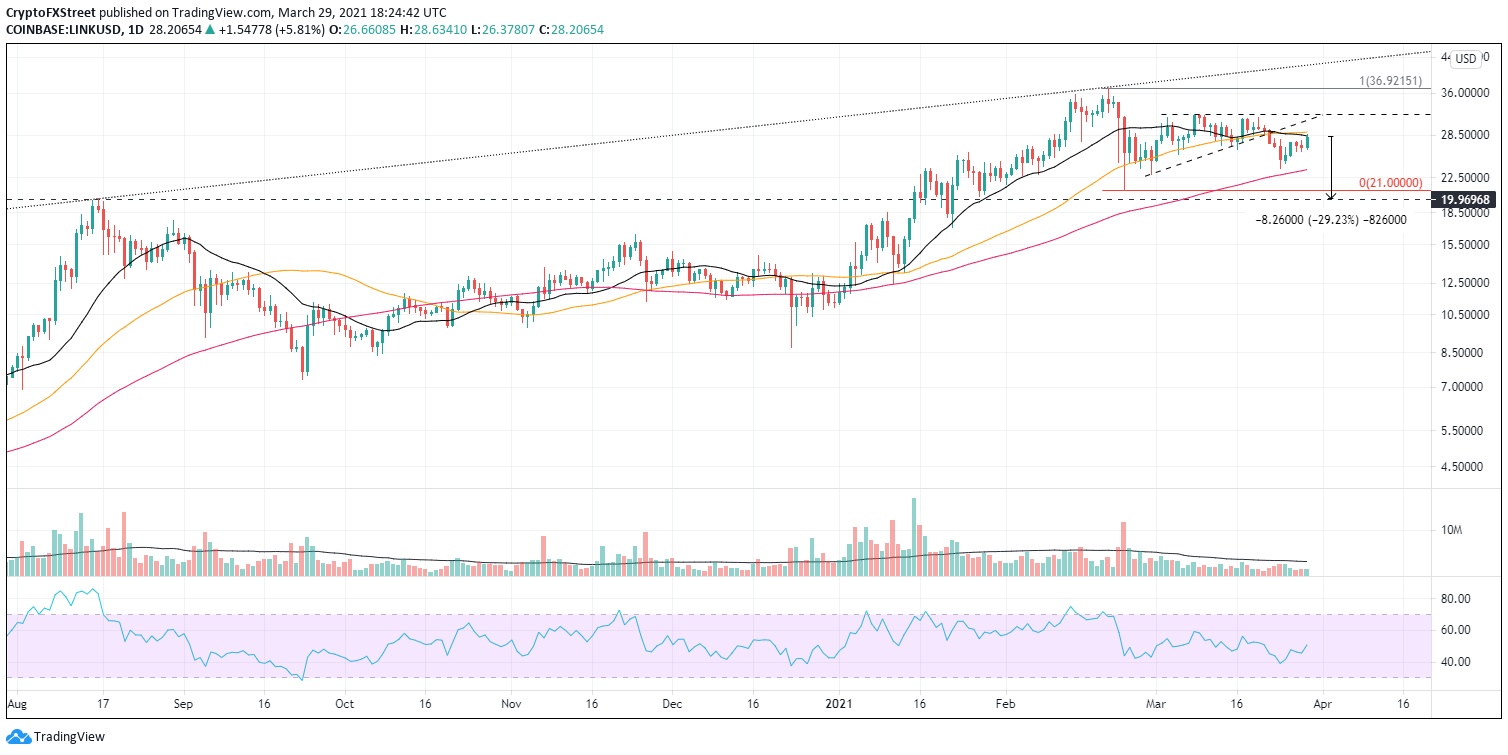
LINK/USD daily chart
If LINK can overcome the key moving averages’ resistance, it will empower the altcoin to test the March 9 high at $32.00. A breach will put the February 20 high at $36.92 in the crosshairs of the bulls.
Author

Sheldon McIntyre, CMT
Independent Analyst
Sheldon has 24 years of investment experience holding various positions in companies based in the United States and Chile. His core competencies include BRIC and G-10 equity markets, swing and position trading and technical analysis.


