Kyber Network Price Analysis: KNC consolidates ahead of colossal 72% upswing
- Kyber Network looks forward to a triangle breakout eyeing $4.9.
- Transaction history reveals a relatively smooth path to $3.5, thus validating the uptrend.
- The RSI on the four-hour chart points downward, signaling a bearish momentum build.

Kyber Network appears to have stalled under $3, delaying the much-anticipated liftoff to new all-time highs. Meanwhile, a key technical pattern has formed on the 12-hour chart, hinting at a potential 72% upswing to $4.9.
Kyber Network eyes symmetrical triangle breakout
The four-hour chart reveals the formation of a symmetrical triangle. This chart pattern is molded by converging a couple of trend lines that link a sequence of peaks and troughs. Generally, the lines are expected to cross at an approximately equal slope. The pattern brings to light a period of consolidation ahead of either a breakout or a breakdown.
A breakdown occurs from the ascending trendline and identifies the beginning of a downtrend. On the other hand, a breakout appears at the descending trendline and denotes the start of a bullish trend.
Symmetrical patterns tend to have precise price targets for breakouts or breakdowns, mainly measured from the highest point to the lowest points. For instance, Kyber Network is likely to swing massively north and achieve another record high milestone around $4.9 on breaking beyond the upper trend line.
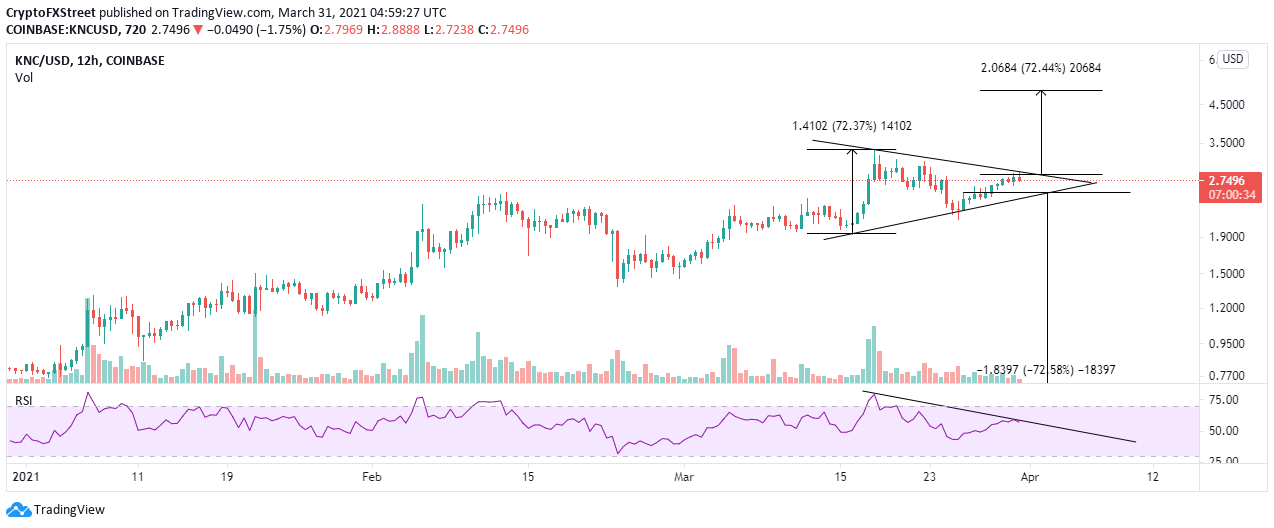
KNC/USD 12-hour chart
The bullish outlook seems to have been validated by IntoTheBlock’s IOMAP model. This on-chain metric shows that the path ahead of Kyber Network is not laced with robust seller congestion zones.
Meanwhile, some delays should be expected between $2.76 and $2.83. Here, 712 addresses previously scooped up around 2.7 million KNC. Trading above this slight resistance would validate the breakout toward $4.9.
On the downside, Kyber Network is sitting on top of an immense buyer congestion zone, running from $2.63 to $2.7. Here, 420 addresses previously purchased roughly 11 million KNC. Other relatively more substantial support levels exist below this robust zone; thus, it would be challenging for bears to stage a significant breakdown.
-637527657517504217.png)
Kyber Network IOMAP chart
Looking at the other side of the fence
Kyber Network hit a wall under $3, delaying the upswing to $4.9. A correction appears to be gaining traction, as observed with the Relative Strength Index (RSI) on the 12-hour chart.
The RSI also features a bearish divergence, further cementing the pessimistic outlook. Closing the day under $3 could also trigger massive losses, accentuated by a symmetrical triangle breakdown.
Author

John Isige
FXStreet
John Isige is a seasoned cryptocurrency journalist and markets analyst committed to delivering high-quality, actionable insights tailored to traders, investors, and crypto enthusiasts. He enjoys deep dives into emerging Web3 tren


