Jupiter Price Forecast: JUP nears bullish breakout as open interest hits three-month high
- Jupiter’s price jumps 10% on Monday, approaching a key descending trendline that could trigger a bullish breakout.
- CoinGlass data shows that JUP’s Open Interest reached $160.43 million, the highest level since February 21.
- The technical outlook suggests a rally ahead, fueled by bullish bets among traders and targeting the $0.87 mark.

Jupiter (JUP) trades in green, gaining over 10% at the time of writing on Monday as it approaches a critical descending trendline. The rally is supported by a sharp rise in JUP’s Open Interest (OI), climbing to a three-month high of over $160 million, according to CoinGlass. The technical outlook suggests a rally ahead, fueled by bullish bets among traders and targeting the $0.87 mark.
Jupiter’s on-chain metrics show a positive bias
Coinglass’ data shows that the futures’ OI in JUP at exchanges rose to $160.43 million on Monday from $122.72 million on Sunday, the highest level since February 21. An increasing OI represents new or additional money entering the market and new buying, which could fuel the current Jupiter price rally.
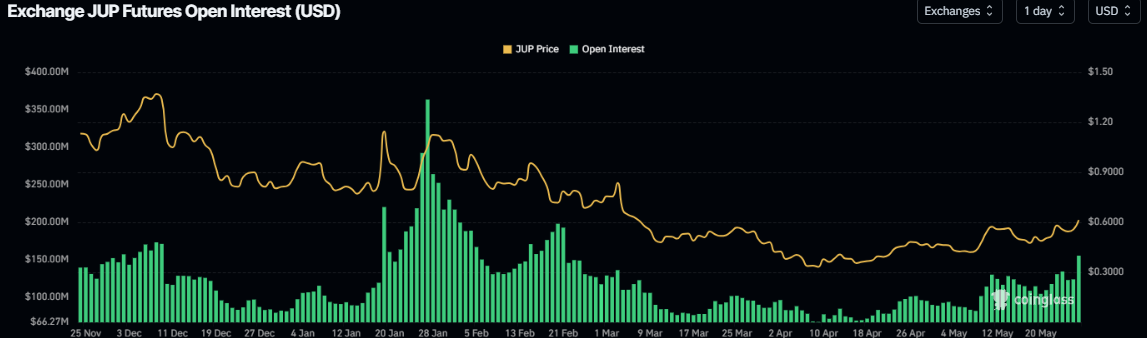
Jupiter Open Interest chart. Source: Coinglass
Another bullish sign is Coinglass’s JUP long-to-short ratio, which reads 1.24, the highest level in over a month. This ratio above one reflects bullish sentiment in the markets as more traders are betting on the asset price to rise.
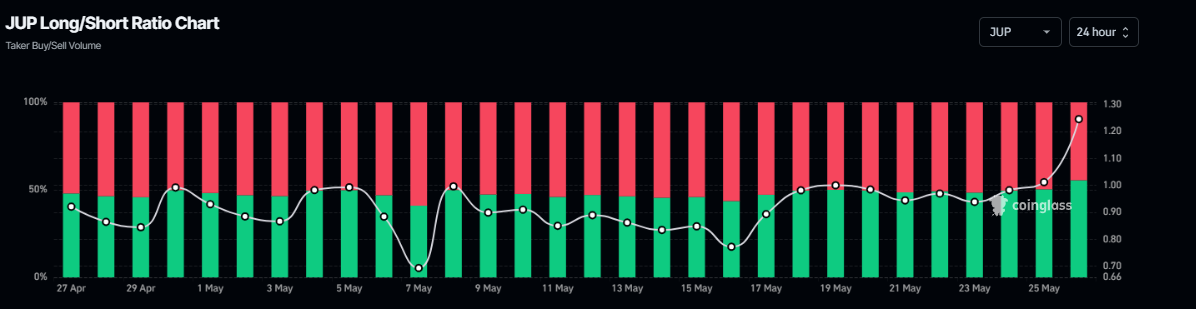
JUP long-to-short ratio chart. Source: Coinglass
Jupiter Price Forecast: JUP bulls target $0.87
Jupiter’s price jumps over 10% on Monday, approaching a descending trendline drawn by joining multiple highs since early December. A breakout of this trendline generally favors the bulls and indicates an upward trend.
If JUP breaks above this trendline and closes above the weekly resistance at $0.67 on a daily basis, it could extend additional gains by 28% to retest the 50% Fibonacci retracement level at $0.87 (drawn from the December high of $1.44 to the April low of $0.30).
The Relative Strength Index (RSI) on the daily chart reads 66 points upward, indicating strong bullish momentum still below overbought levels. Additionally, the Moving Average Convergence Divergence (MACD) indicator showed a bullish crossover last week. It also shows a rising green histogram above its neutral level, indicating an upward trend.
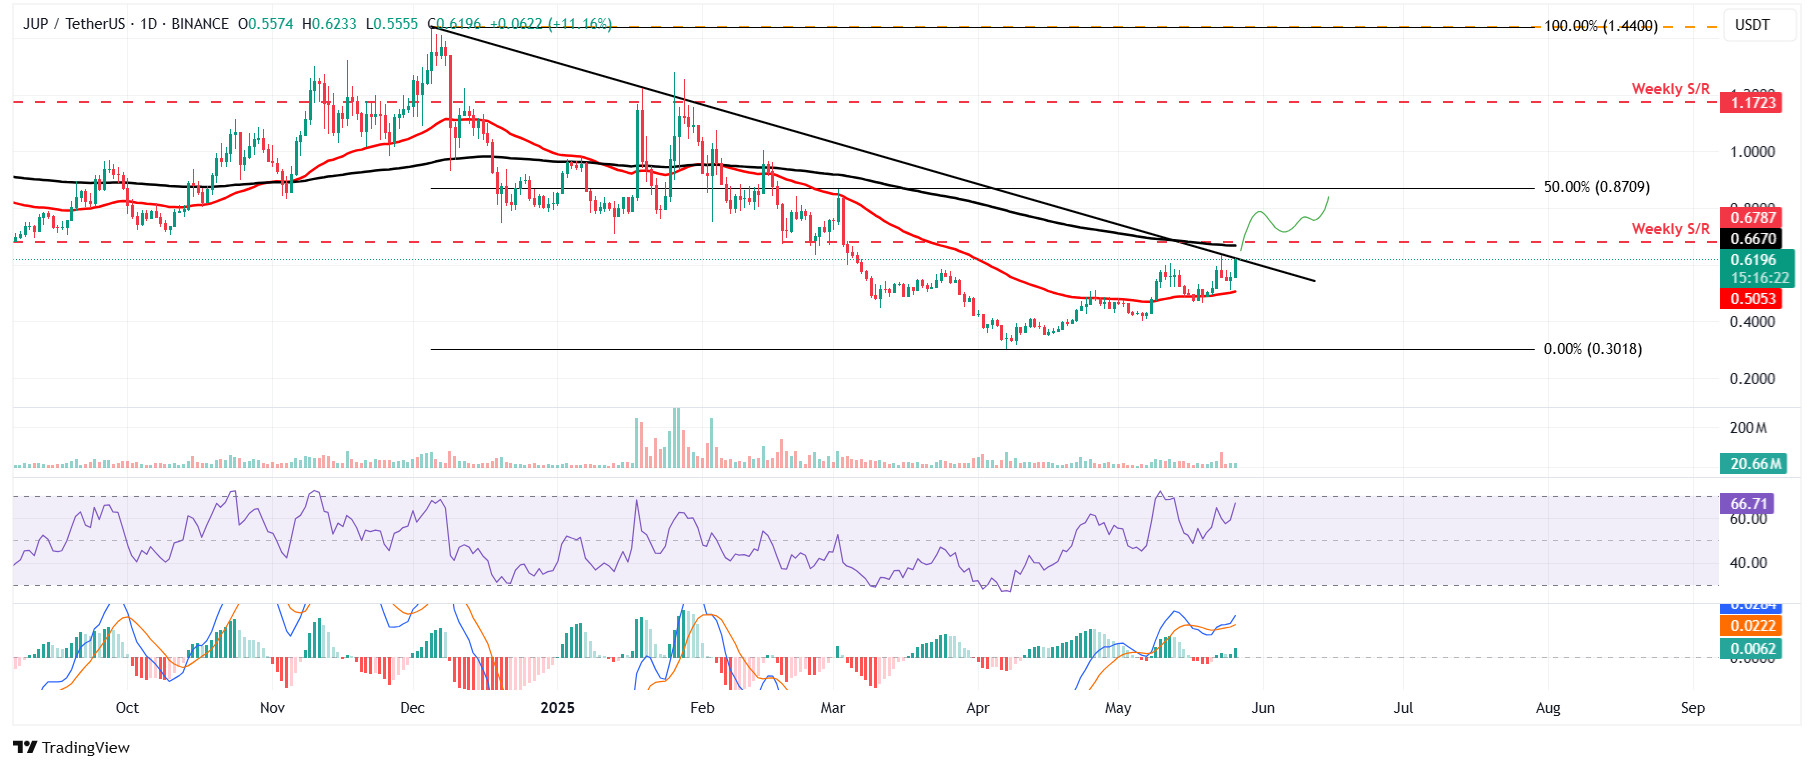
JUP/USDT daily chart
However, if JUP faces a pullback around the descending trendline, it could extend the correction to retest the 50-day Exponential Moving Average (EMA) at $0.50.
Author

Manish Chhetri
FXStreet
Manish Chhetri is a crypto specialist with over four years of experience in the cryptocurrency industry.


