Is yesterday's decline the last one before Ethereum (ETH) sets new peaks?

The cryptocurrency has completely recovered since yesterday's drop as all top 10 coins are again in the green zone. Chainlink (LINK) is the top gainer from the list, rising by 13%.
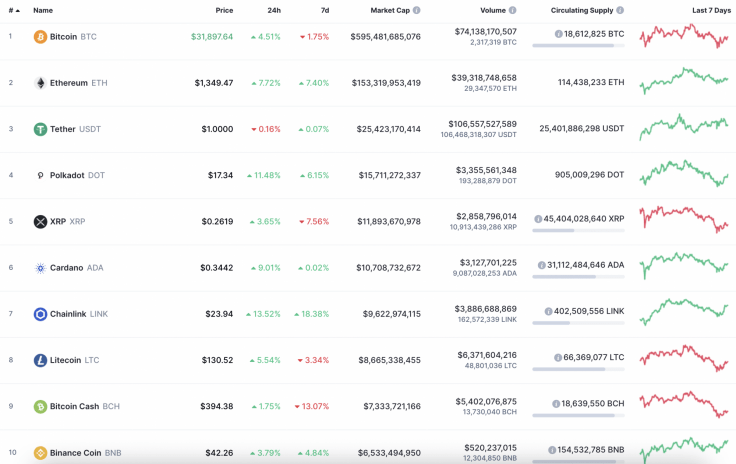
Top 10 coins by CoinMarketCap
However, cryptocurrency market capitalization has not come back to the $1 trillion mark and now makes up $954 billion.
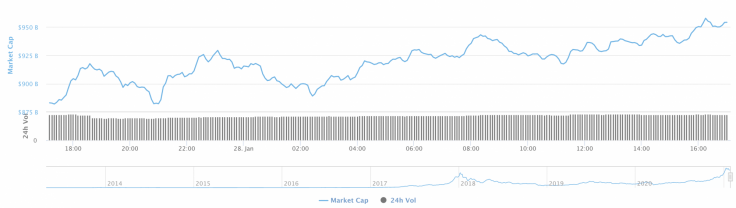
Cryptocurrency market capitalization
The relevant data on Ethereum today
-
Name: Ethereum.
-
Ticker: ETH.
-
Market Cap: $154,438,342,917.
-
Price: $1,349.53.
-
Volume (24h): $38,766,320,619.
-
Change (24h): 9.17%.
The data is relevant at press time.
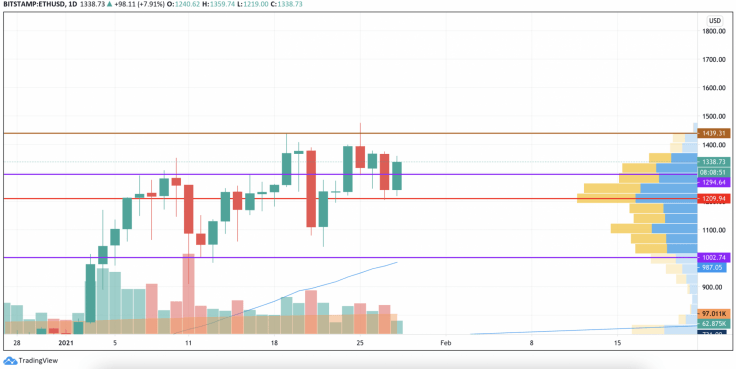
ETH/USD: Can one expect another correction on the way to $1,400?
Yesterday sellers pushed the support of $1,250 and tested the blue uptrend line. This trend line limited the pair's decline, marking the lower border of the sideways trend.
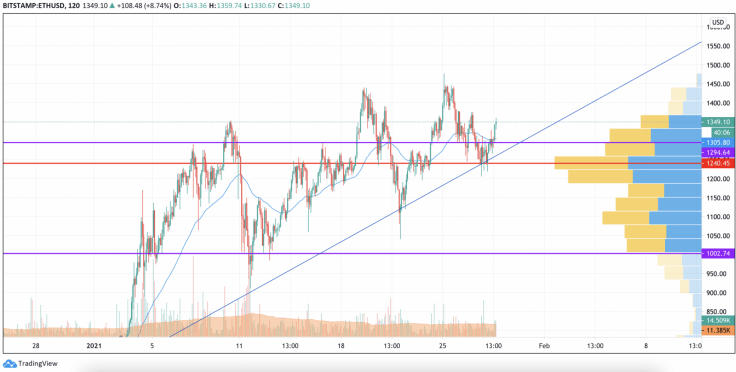
ETH/USD chart by TradingView
If buyers break through the resistance of the EMA55 moving average today, the pair may leave the sideways range and test the resistance of $1,400.
ETH/USD chart by TradingView
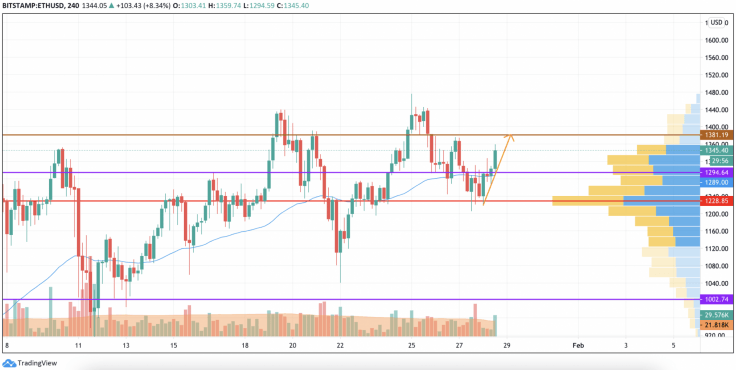
On the 4H chart, Ethereum (ETH) is bullish as it has the chance to retest the local resistance at $1,381.
However, such a move should be considered a part of a correction phase but not a prerequisite for setting new peaks.
ETH/USD chart by TradingView
On the daily chart, Ethereum (ETH) is also more bullish than bearish. Buyers' power is confirmed by high liquidity at the current levels, however, the trading volume is low, making it difficult to talk about an all-time high. All in all, the area around $1,430 may be a magnet for bulls shortly.
Ethereum is trading at $1,339 at press time.
Read full original article on U.Today
Author

Denys Serhiichuk
U.Today
With more than 5 years of trading, Denys has a deep knowledge of both technical and fundamental market analysis.


