Is the Zilliqa price prepping for a monstrous 50% decline?
- Zilliqa price shows significant bearish divergence amidst the countertrend move.
- ZIL price has strong Fibonacci targets 50% lower than today's current market value.
- Invalidation of the downtrend scenario is a breach above $0.058

Zilliqa price could be due for a serious liquidation. Key levels have been identified.
Zilliqa price looks weakened
ZiIliqa price merits considerable concern as the ERC-20 token has failed to hold support at both the 8- and 21-day simple moving averages. Since July 1, the ZIL price has rallied 50% to just under $0.050. Unfortunately, the uptrend’s move has come under very low volume, which confounds the idea that Zilliqa price could be at risk of a massive besiegement from overpowering bears.
Zilliqa price currently auctions at $0.043. A Fibonacci retracement indicator surrounding the largest rally from March 2020 into highs from May 2021 suggests the current price is just 38.2 % down from all-time highs. Because ZIL price has printed three sets of macro impulse waves up, the probability of a 50-61.8% retracement is very likely. If the bulls cannot re-hurdle the breached moving averages with an influx of volume, the sell-off targeting $0.020 and lower could very well be underway.
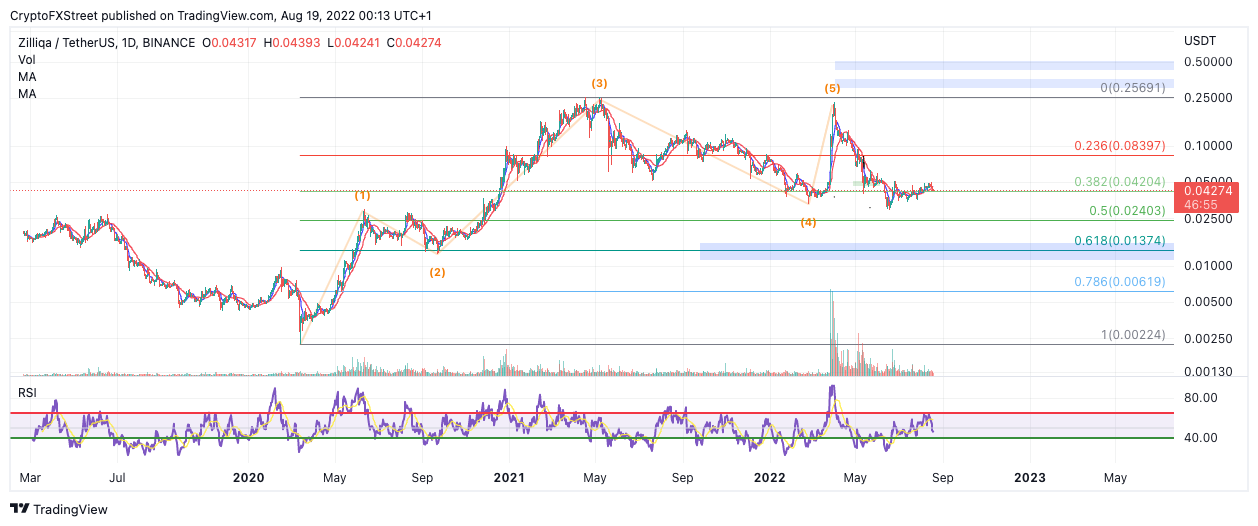
ZIL/USDT 1-Day Chart
Invalidation of the bearish thesis is a breach above $0.058. If the bulls can breach this barrier, they may be able to induce a buyers rally targeting $0.080 in the short term, resulting in a 90% increase from the current Zilliqa price
In the following video, our analysts deep dive into the price action of Bitcoin, analyzing key levels of interest in the market. -FXStreet Team
Author

Tony M.
FXStreet Contributor
Tony Montpeirous began investing in cryptocurrencies in 2017. His trading style incorporates Elliot Wave, Auction Market Theory, Fibonacci and price action as the cornerstone of his technical analysis.


