Is Ethereum ready to rally to $5,000?

Like many others, the second-largest cryptocurrency, Ethereum (ETHUSD), topped out in March this year. It has lost almost 50% since. However, we must remember that ETHUSD bottomed out over two years ago, on June 18, 2022, and rallied 365%. Thus, the current correction is still within the realm of normality within the world of cryptos, but we must ask, “Is the Bull market since that low over?”
Our preferred analysis method is the Elliott Wave Principle (EWP), which tells us that dominant market moves comprise five waves (1, 2, 3, 4, 5), and corrective phases consist of three waves (a, b, c). The decline from the March high into last Monday’s low still counts best as three waves: W-X-Y. See Figure 1 below.
Figure 1. The daily resolution candlestick chart of ETH with several technical indicators
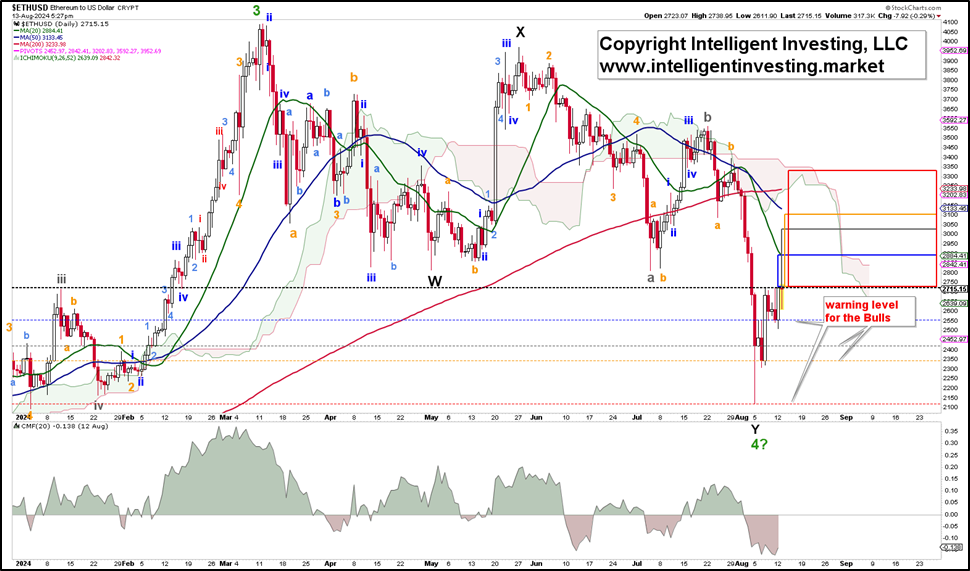
ETHUD is clearly struggling with the $2725 level, the January 2024 high (dotted black horizontal line) having bumped into it five times over the last six days. Thus, it is a key level for the Bulls to recapture on a daily closing basis. The colored rectangles show the upside we can expect based on simple symmetry, measured from each warning level for such a breakout.
-
1st, blue, target: ~$2900, which equates to the green 20d SMA.
-
2nd, grey, target: on a daily close above the 1st target is ~$3025.
-
3rd, orange, target: on a daily close above the 2nd target is ~$3100.
-
4th, red, target: on a daily close above the 3rd target is ~$3325.
These are not guarantees—there are never any—but these are the most likely upside targets on subsequent breakouts, as symmetry is often important. If we see those breakouts, we can assign a more reliable EWP count to the rally from last Monday's low. Unfortunately, at this stage, we cannot yet distinguish between the "low in," as shown in Figure 1, and the "one more 5th wave lower" option. See Figure 2 below.
Figure 2. The daily resolution candlestick chart of ETH with several technical indicators
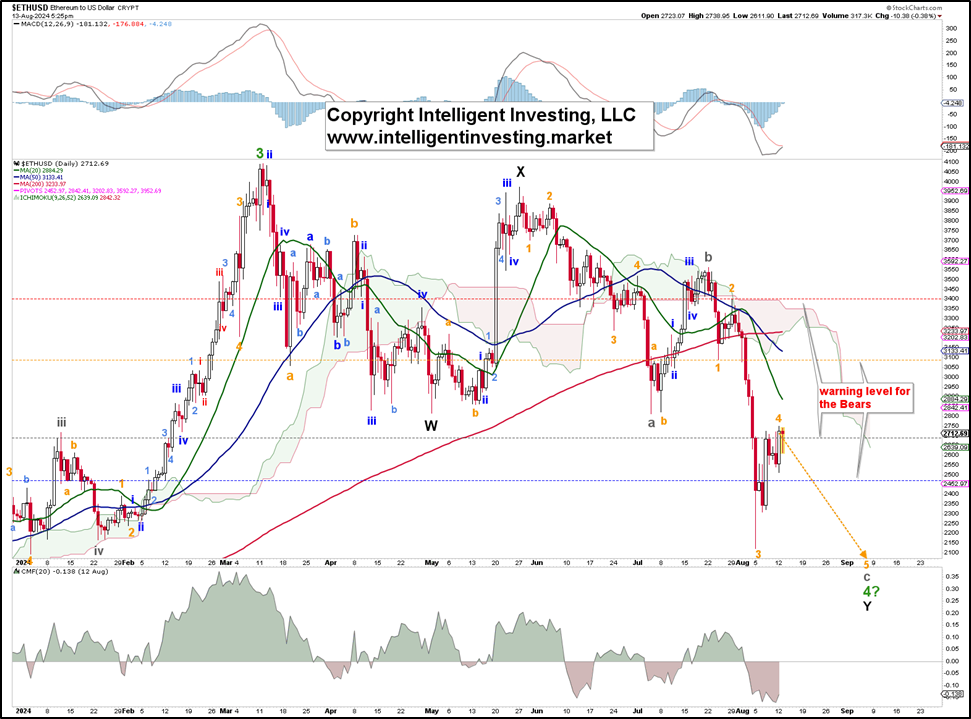
Thus, the colored warning levels in each chart/option are our guides until one option is proven; they are communicated daily to our premium members as they indicate the warning levels for the Bulls or Bears if the chart shows a Bullish or Bearish EWP, respectively.
-
Blue = the first warning: chances increase count invalidated and/or directional move over.
-
Grey = the second warning: increased chance the count is invalidated and/or directional move is over,
-
Orange = the third warning: count most likely invalidated or the directional move most likely over,
-
Red = the final warning: count is invalidated, and the directional move is over.
We remain long-term Bullish on this cryptocurrency, which started its Bull run towards ideally $10+/-2.5K in 2022, contingent on holding above $2150.
Author

Dr. Arnout Ter Schure
Intelligent Investing, LLC
After having worked for over ten years within the field of energy and the environment, Dr.


