Is Bitcoin ready to skyrocket again?

The valuation of the whole crypto market fell by over $2 trillion in just one year. The current market cap of all cryptocurrencies is $867 billion, while Bitcoin alone has a market cap of $332 billion. The arrival of the new year is starting debates on whether there will finally be a reversal. We will analyze Bitcoin through several timeframes to determine the most probable outcomes.
Weekly timeframe
The weekly timeframe is showing the important signals. As Bitcoin trades below $20,000, it is clear Bitcoin has become severely oversold. Only a few times in the history has BTC fallen like it had last year as shown in the tweet. As a result, many investors are now eyeing crypto markets, but there’s still danger ahead.
A bullish divergence predicted the last two and most important pullbacks on Bitcoin in the last 12 months. Now there’s a third divergence suggesting a new upward movement may occur. Bitcoin is actually up 12% from its bottom formed in November.
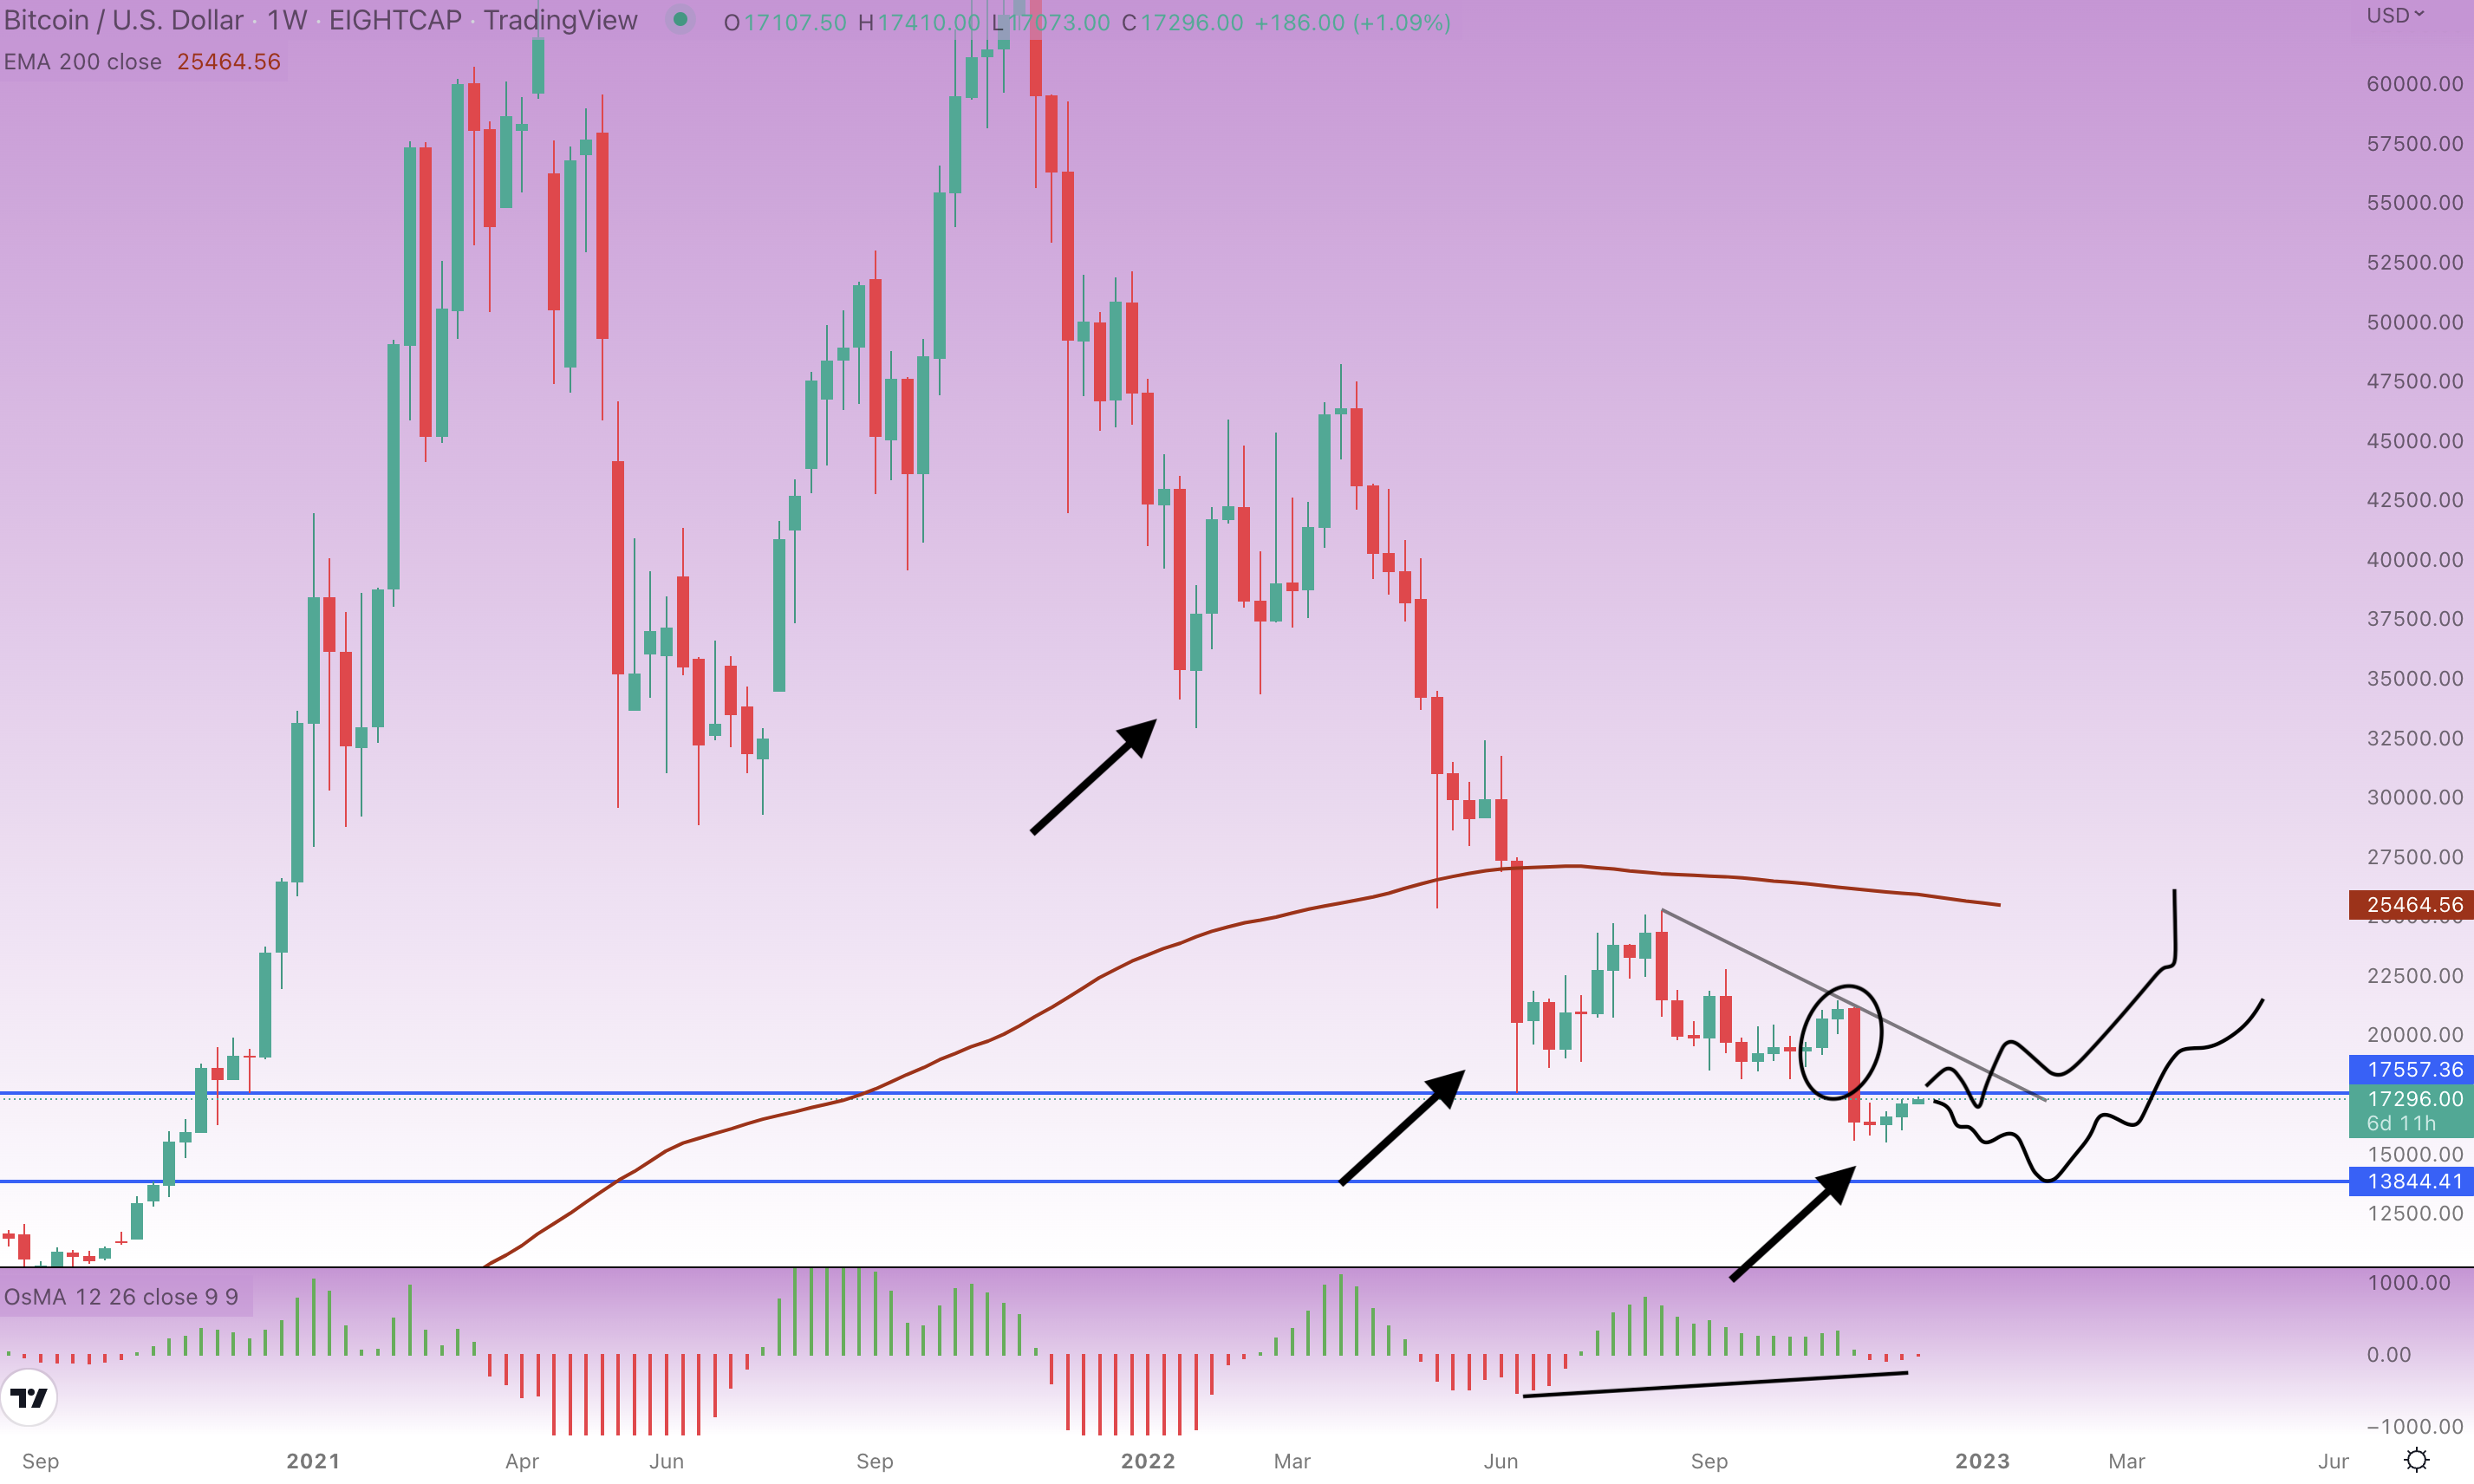
So yes, the bottom might be in, but there are two things that could still send BTC lower. Unless the trend line is broken, there is no uptrend. Moreover, there is a huge engulfing along with a gap caused a continuation of this downtrend. The cryptocurrency could tank any time while filling the gap - the next few weeks will be crucial in determining the future trend.
Daily timeframe
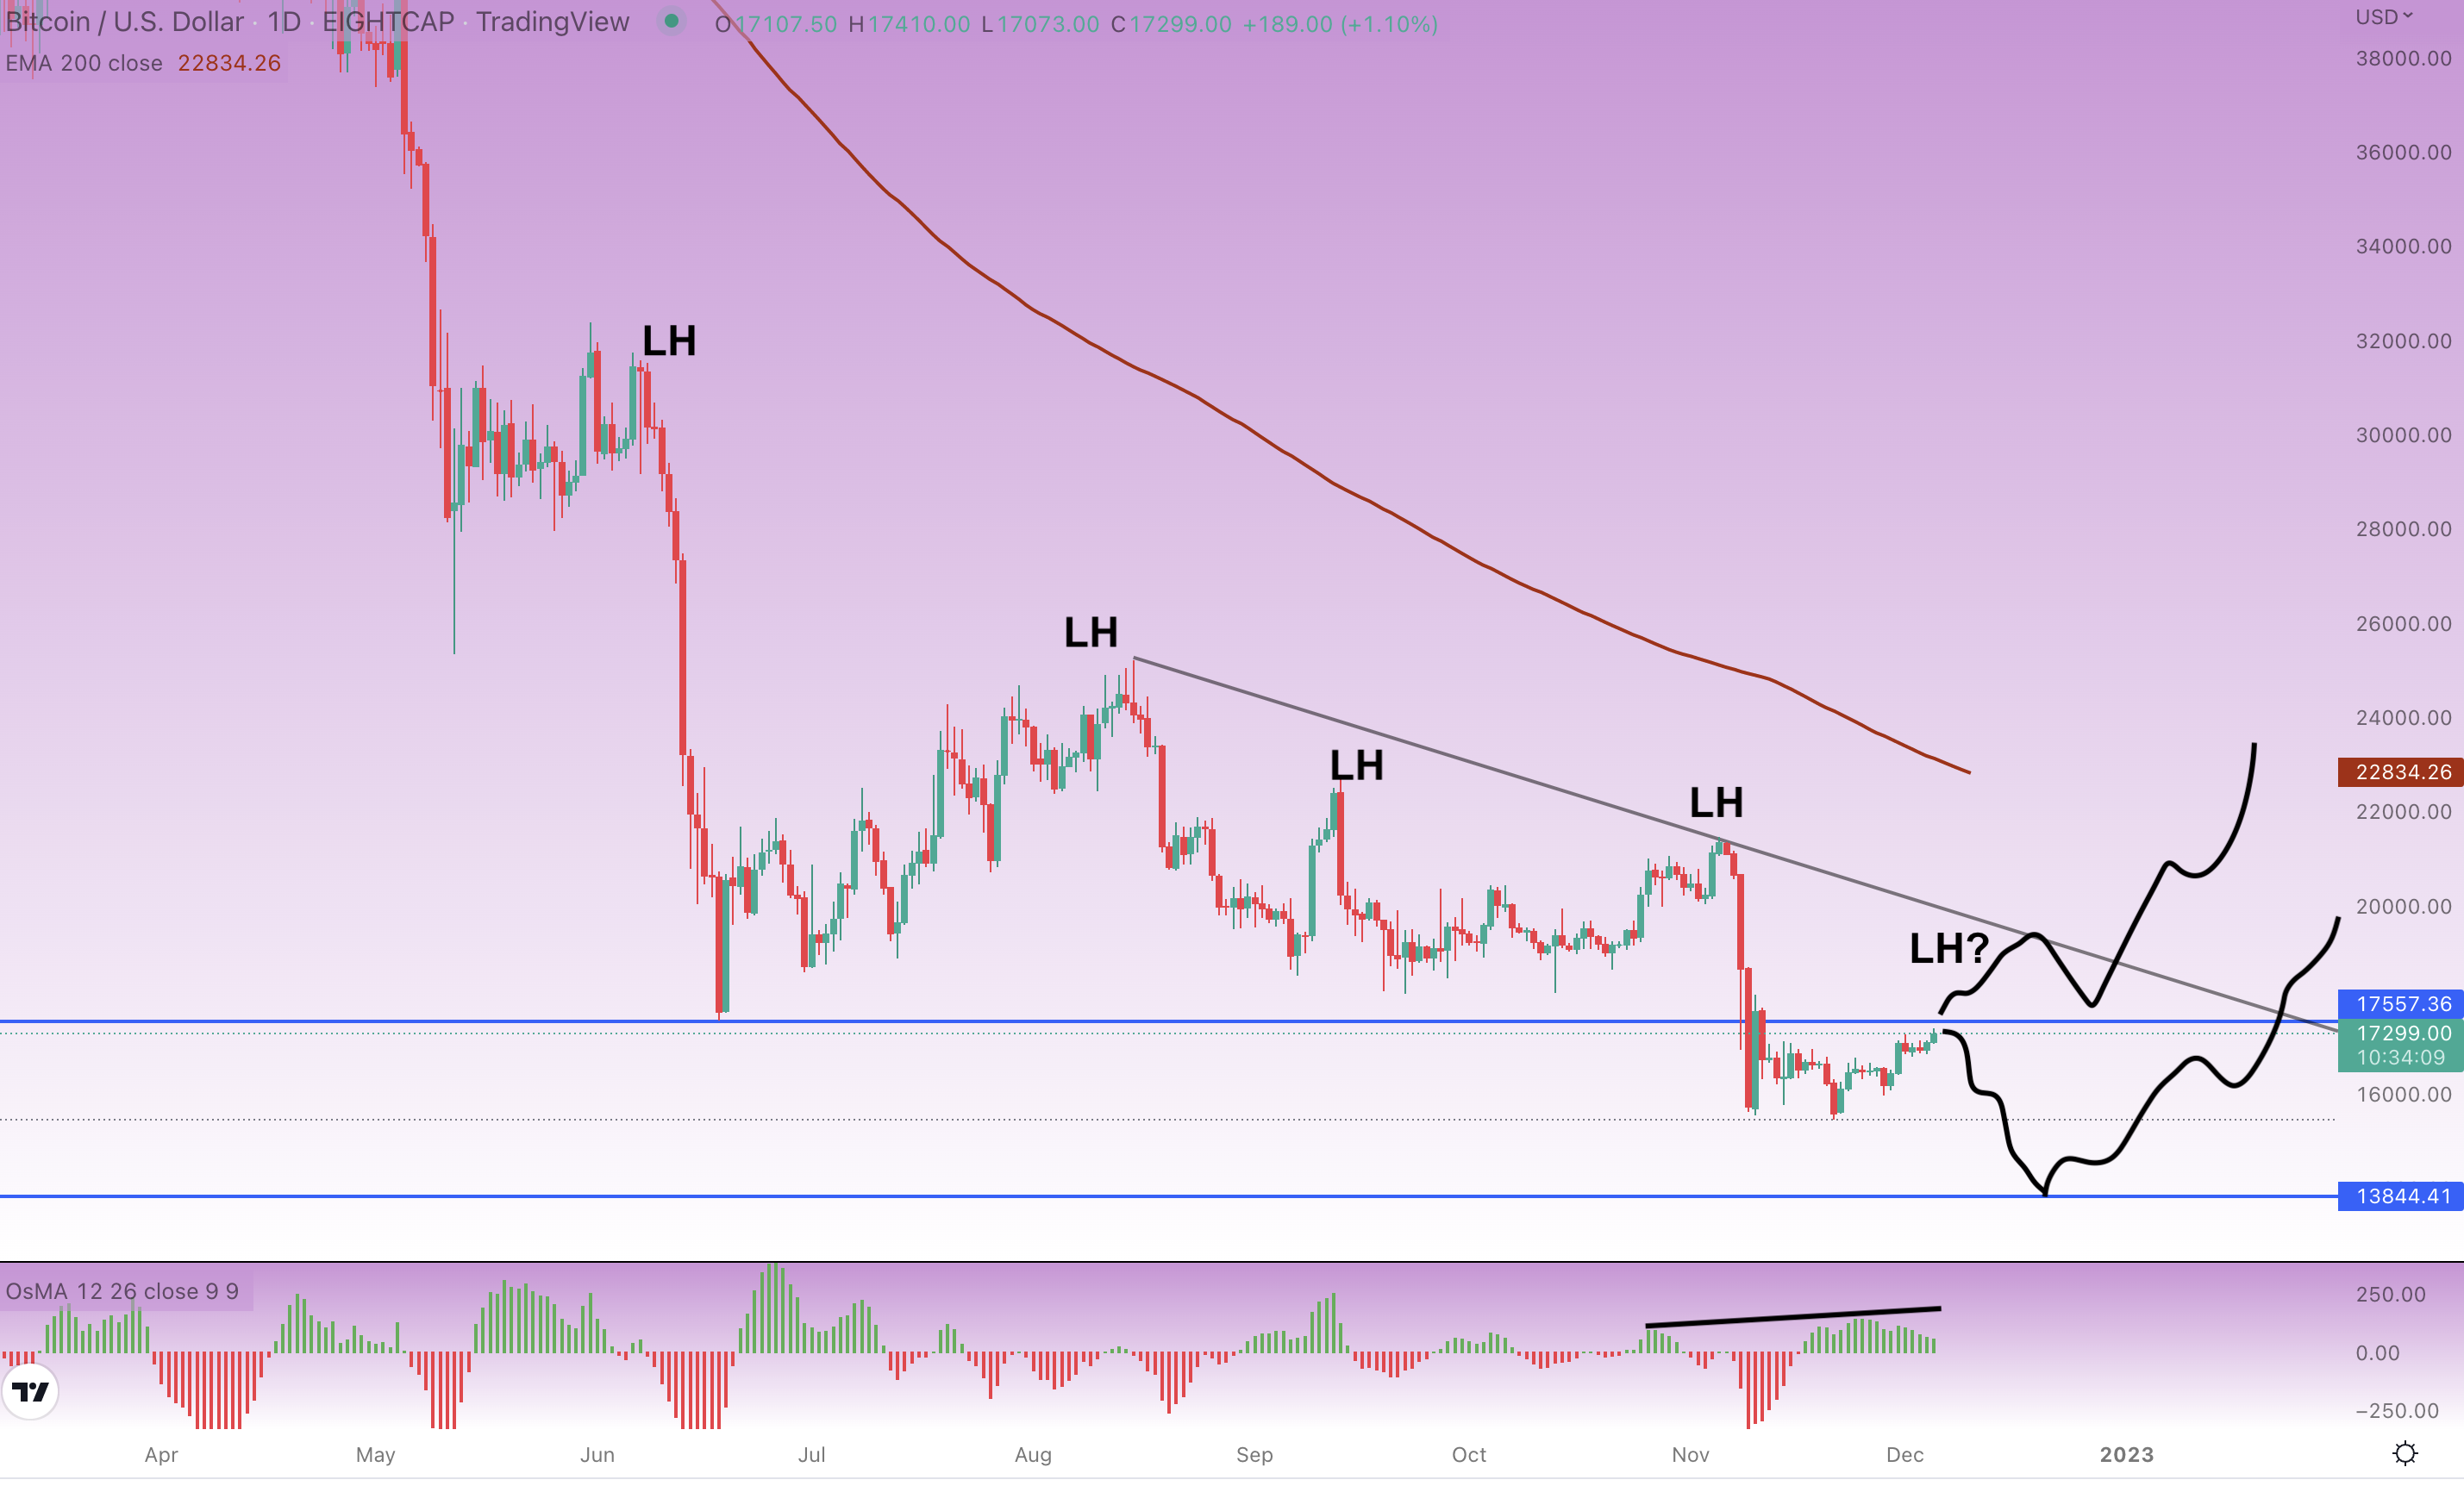
While the bullish divergence on a weekly timeframe suggests Bitcoin could be moving up soon, a bearish divergence on a daily timeframe shows it could still form a lower leg to $14k-$15k. This is the ideal time for long-term investors to dollar-cost average their positions as the bottom is nearing.
Bitcoin is currently at an important resistance of $17,557 (June’s low), so it could still bounce downward to form a new low. Bitcoin has been forming lower highs (LH) over the past few months. There is a high probability a new LH will be created, which will result in a lower low (LL) as well. Most important of all will be watching that trend line because once Bitcoin gets above it, uptrend is back in game. btc daily
Bitcoin stopped at the moving average (EMA200) and resistance, indicating it could be ready for the next move to the downside. However, traders should wait for the confirmation signal by watching the trend line on a 4-hour timeframe.
If this trend line gets broken, BTC could tumble another 15% to 20%. It’s vital to point out the fact, that this is one of the longest bear markets the crypto market ever recorded, so there is a very high probability that a local bottom formation is near. So even Bitcoin falls another 15%, it won’t last there long like in 2018, 2015 and 2011.
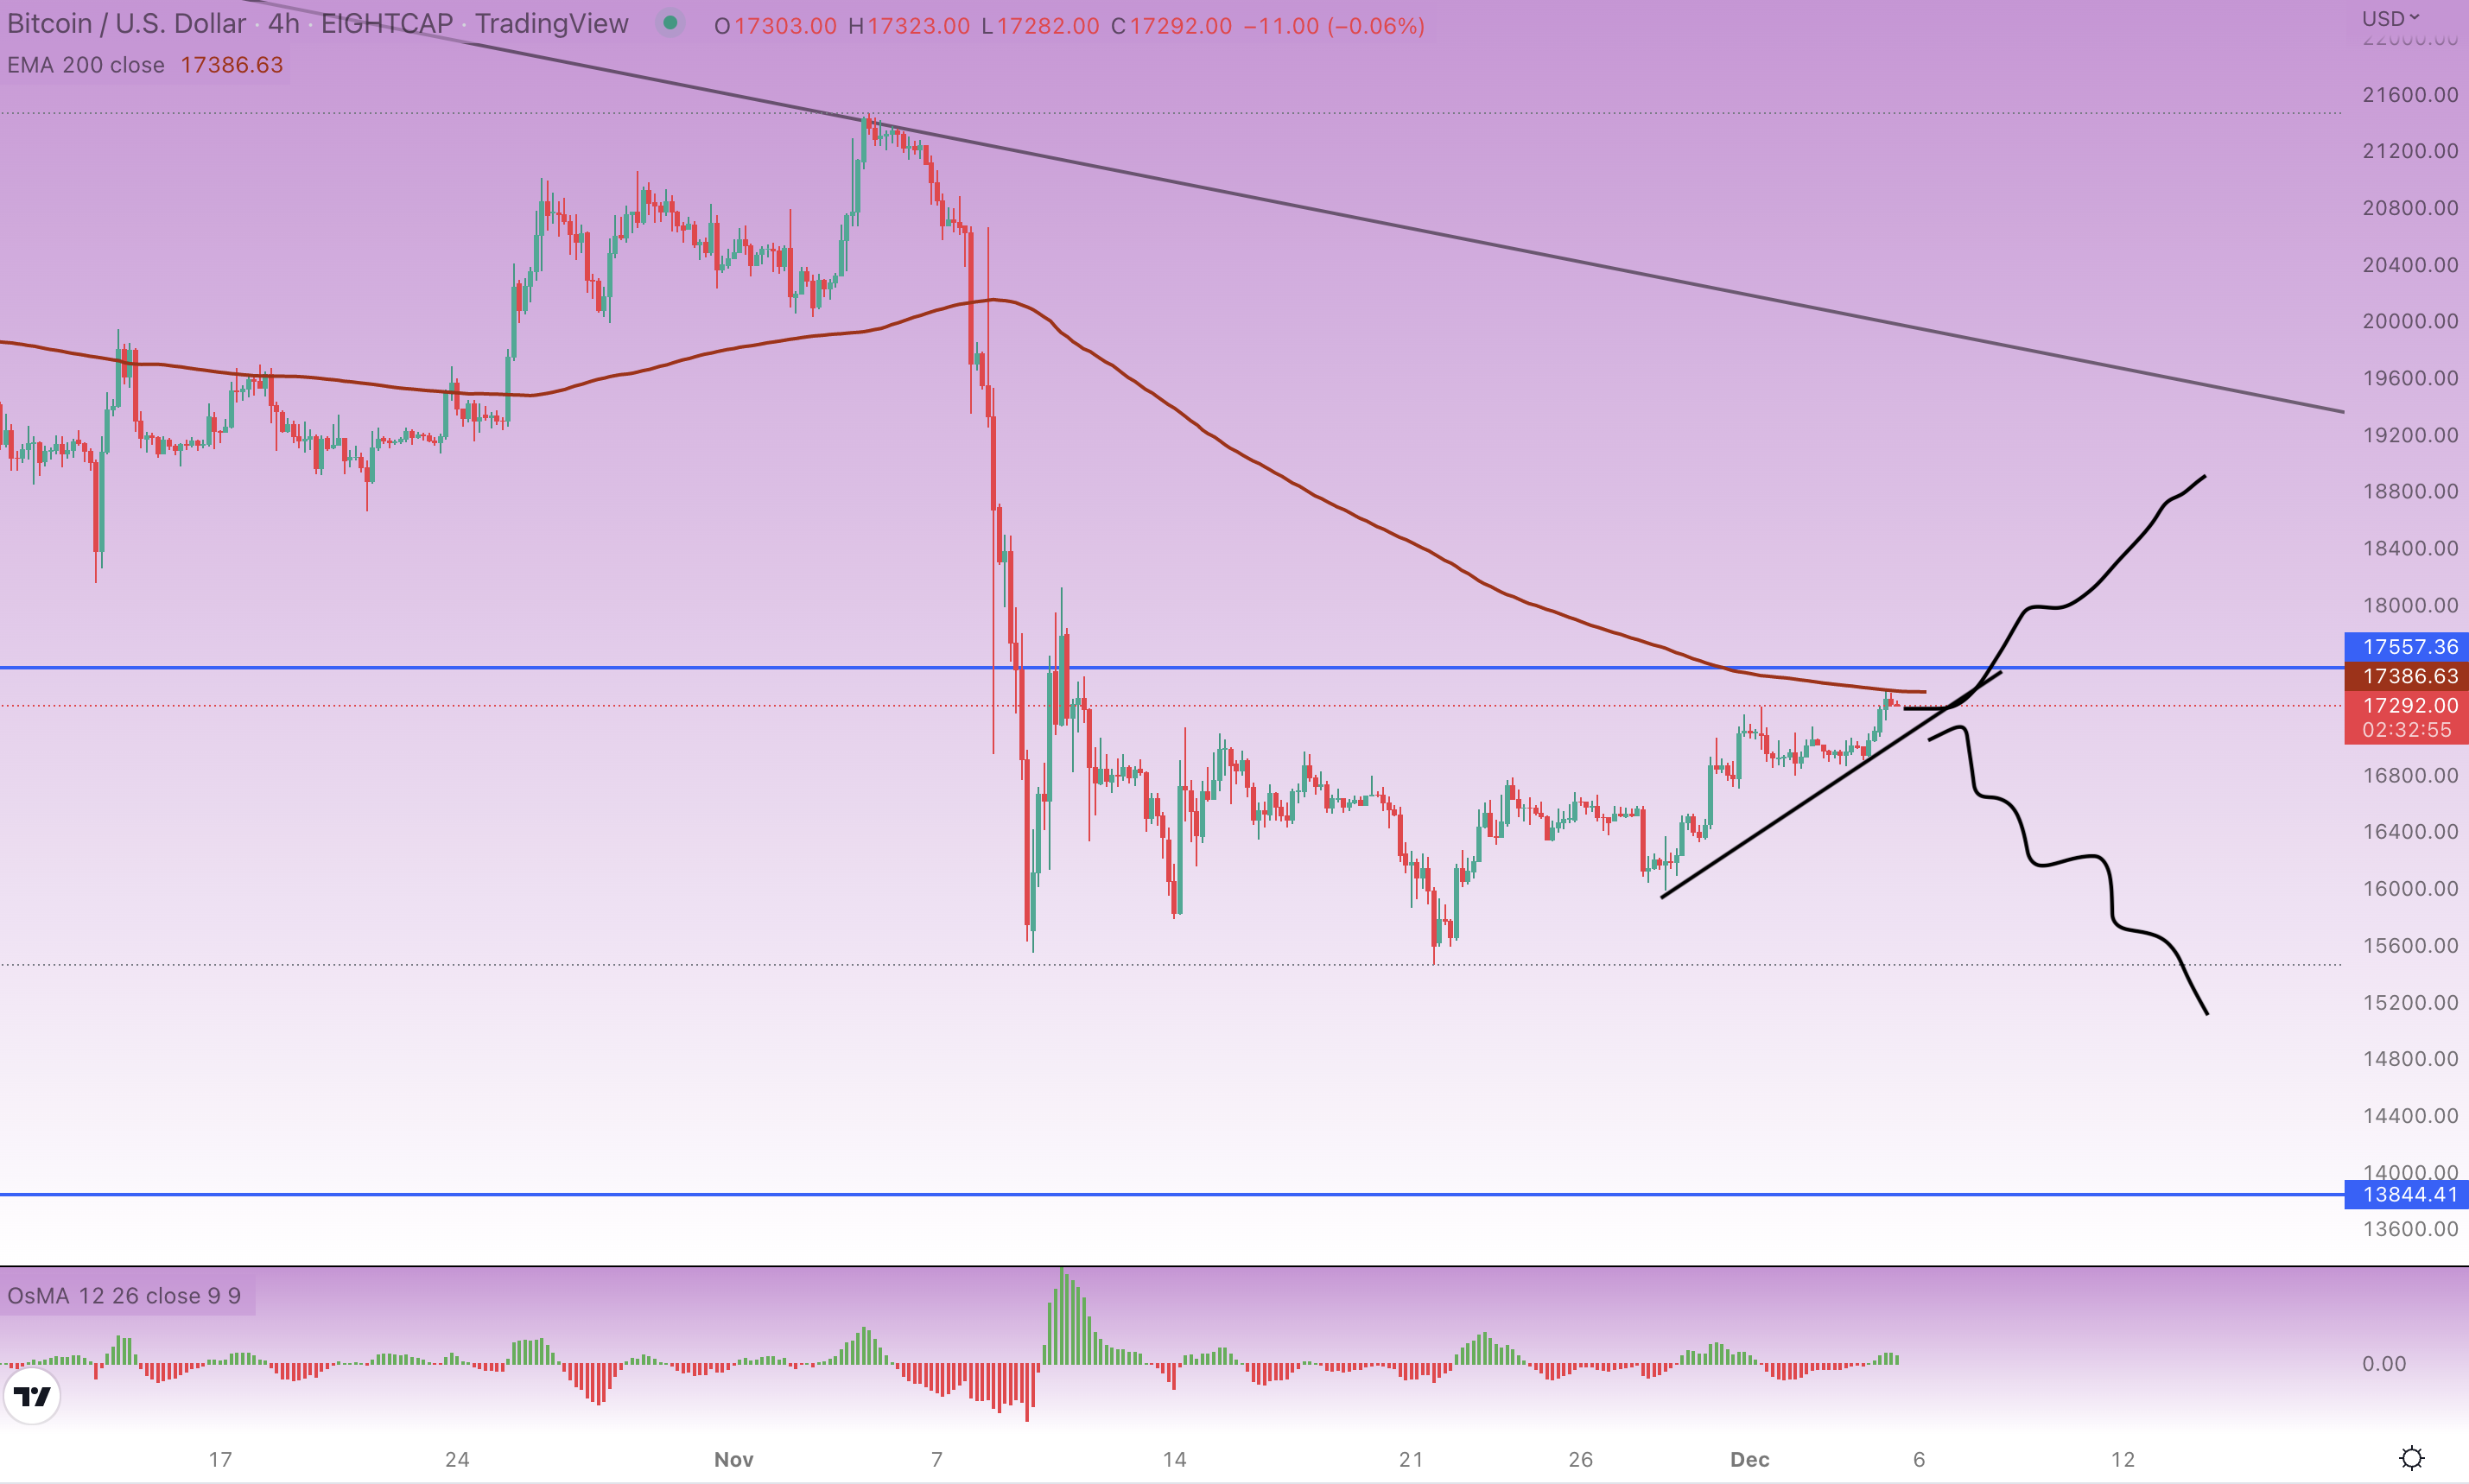
If Bitcoin rises above $17,557, it may be headed back to almost $20,000, where there is a trend line. The probability of Bitcoin heading down in the short-term is high, but it is very likely to bottom out in end of the year or by the beginning of 2023.
Author

Rene Remsik
Investro
Rene got into financial markets by accident in 2012 and started with Forex trading. Later in 2017, he started investing in stocks in cryptocurrencies and began writing articles professionally.


