IOTA Price Forecast: IOT/USD rise hampered by the SMA 20 curve
- IOT/USD bulls managed to break the $0.23 price barrier.
- The SMA 20 curve acts as immediate market resistance.
- The Elliott Oscillator has had a green session, following 11 straight red sessions.

IOT/USD daily chart
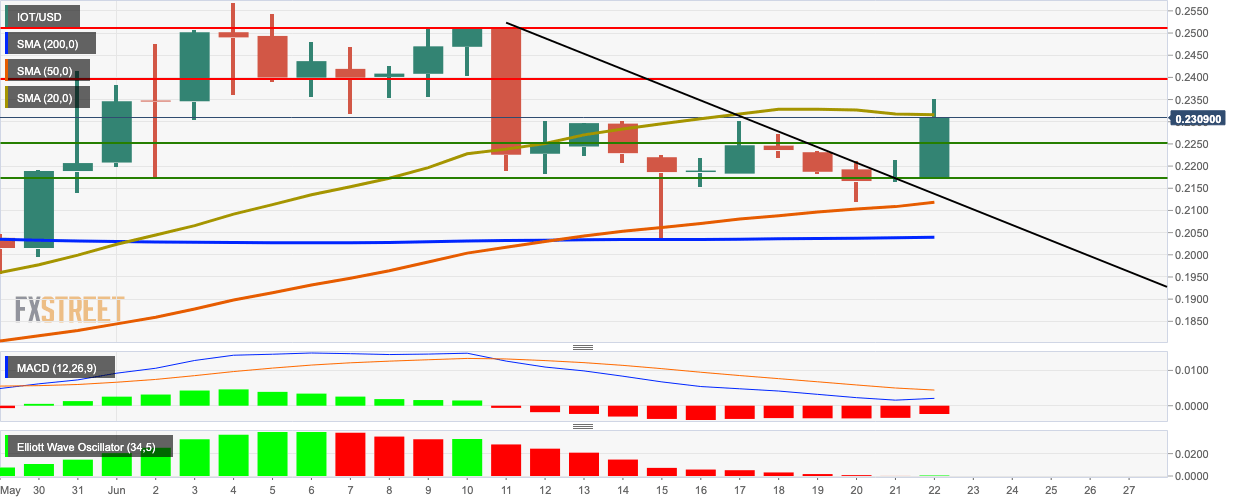
IOT/USD jumps from $0.217 to $0.231 as the bulls took charge broke past the $0.22 and $0.23 psychological levels. The MACD shows decreasing bearish market momentum, while the Elliott Oscillator has had a green session after 11 straight red sessions.
Support and Resistance
The SMA 20 curve acts as immediate market resistance. Up ahead, strong resistance levels lie at $0.24 and $0.25. On the downside, healthy support levels lie at $0.225, $0.217, SMA 50 and SMA 200.
Key levels
Author

Rajarshi Mitra
Independent Analyst
Rajarshi entered the blockchain space in 2016. He is a blockchain researcher who has worked for Blockgeeks and has done research work for several ICOs. He gets regularly invited to give talks on the blockchain technology and cryptocurrencies.
More from Rajarshi Mitra


