Investors’ guide on navigating Bitcoin price volatility through multiple scenarios
- Bitcoin price shows a tight consolidation after the recent 17% crash to $21,283.
- A breakdown of the $20,750 support level could lead to a 15% sell-off to a range low at $17,578.
- However, a sweep of $20,750 followed by a quick recovery could lead to a 12% bounce to $23,175.

Bitcoin price seems to have slid back into consolidation after the recent market sell-off. This development causes uncertainty to spike, leaving investors wondering if they should start buying the dip or taper off on their investments.
Bitcoin price in a suspended state
Bitcoin price faced massive selling pressure at $24,664, aka the midpoint of the $17,578 to $31,749 range. After multiple rejections here, BTC crashed nearly 20% and retested $20,750 for the third time over the last month.
A breakdown of the ongoing consolidation could head in two directions:
- A sweep of the $20,750 level followed by a quick recovery.
- A breakdown of $20,750, leading to a crash that could revisit the June 19 swing low at $17,578.
Investors can assume the first scenario to unfold, considering the upcoming Merge update for the Ethereum blockchain on September 15. The Merge-led rally seems to have caused a lot of altcoins to explode like its bull run.
As the scheduled date approaches, capital could very likely flow from BTC to ETH and other altcoins. This could cause Bitcoin price to consolidate around $20,750 aimlessly. However, if the capital is divided between BTC and ETH, then a quick sweep followed by a recovery seems like a plausible outcome.
The bounce could see Bitcoin price revisit the intermediate resistance level at $22,500. If buyers continue to keep the pressure, an extension of this recovery to $23,175 seems likely and on the cards.
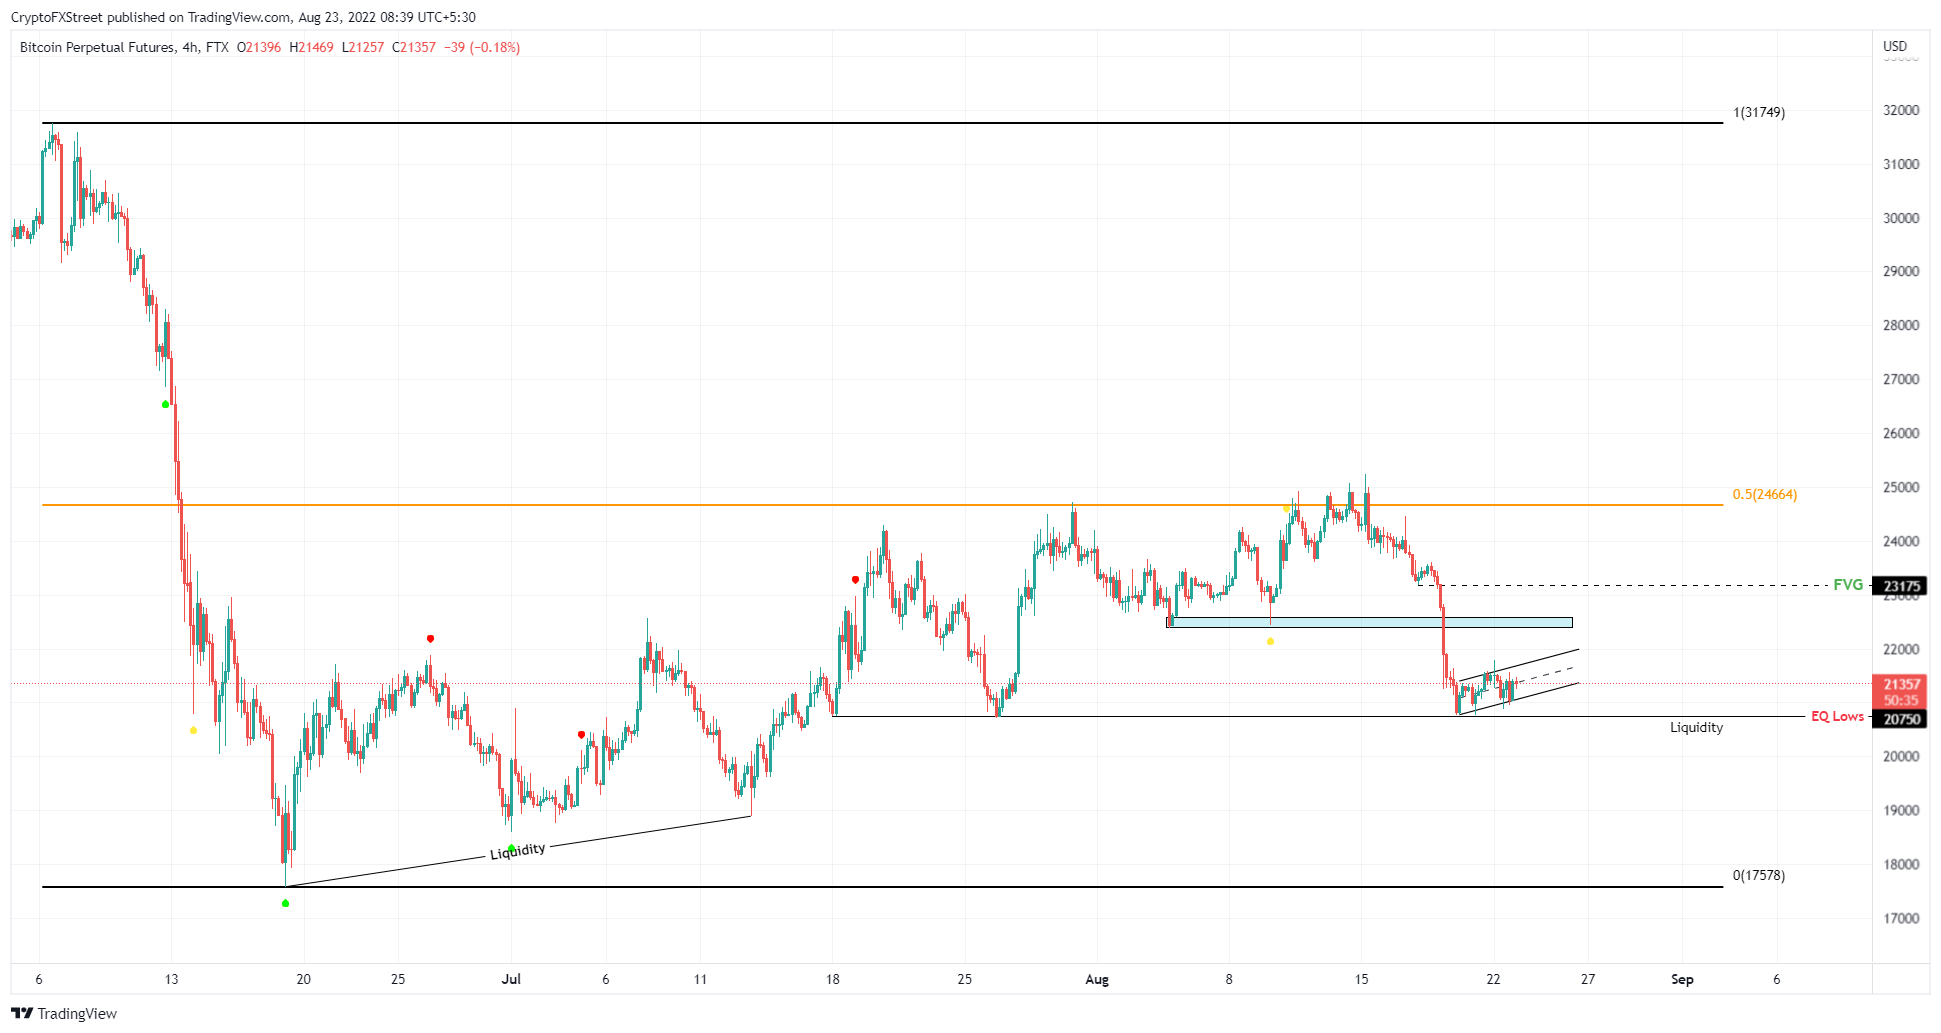
BTC/USDT 4-hour chart
Alternate scenario and its ramifications
However, if Bitcoin price ignores the upcoming Merge and flips the $20,750 support level into a resistance barrier, it will confirm a bearish resurgence. In such a case, let’s take a look at the higher time frame chart.
The daily outlook for BTC shows that it has been consolidating and crashing since the start of 2022. The recent crash has pushed the Point of Control (POC) to $21,177, which is the highest volume traded level since June 10.
A breakdown of this level could result in a 10% drop to roughly $19,000 Even in this bearish outlook, this level is the last point of support for Bitcoin price.
While unlikely to happen in the next few weeks, a breakdown of the aforementioned support area would lead to a catastrophic crash to these support levels - $15,500, $13,500 and $11,900.
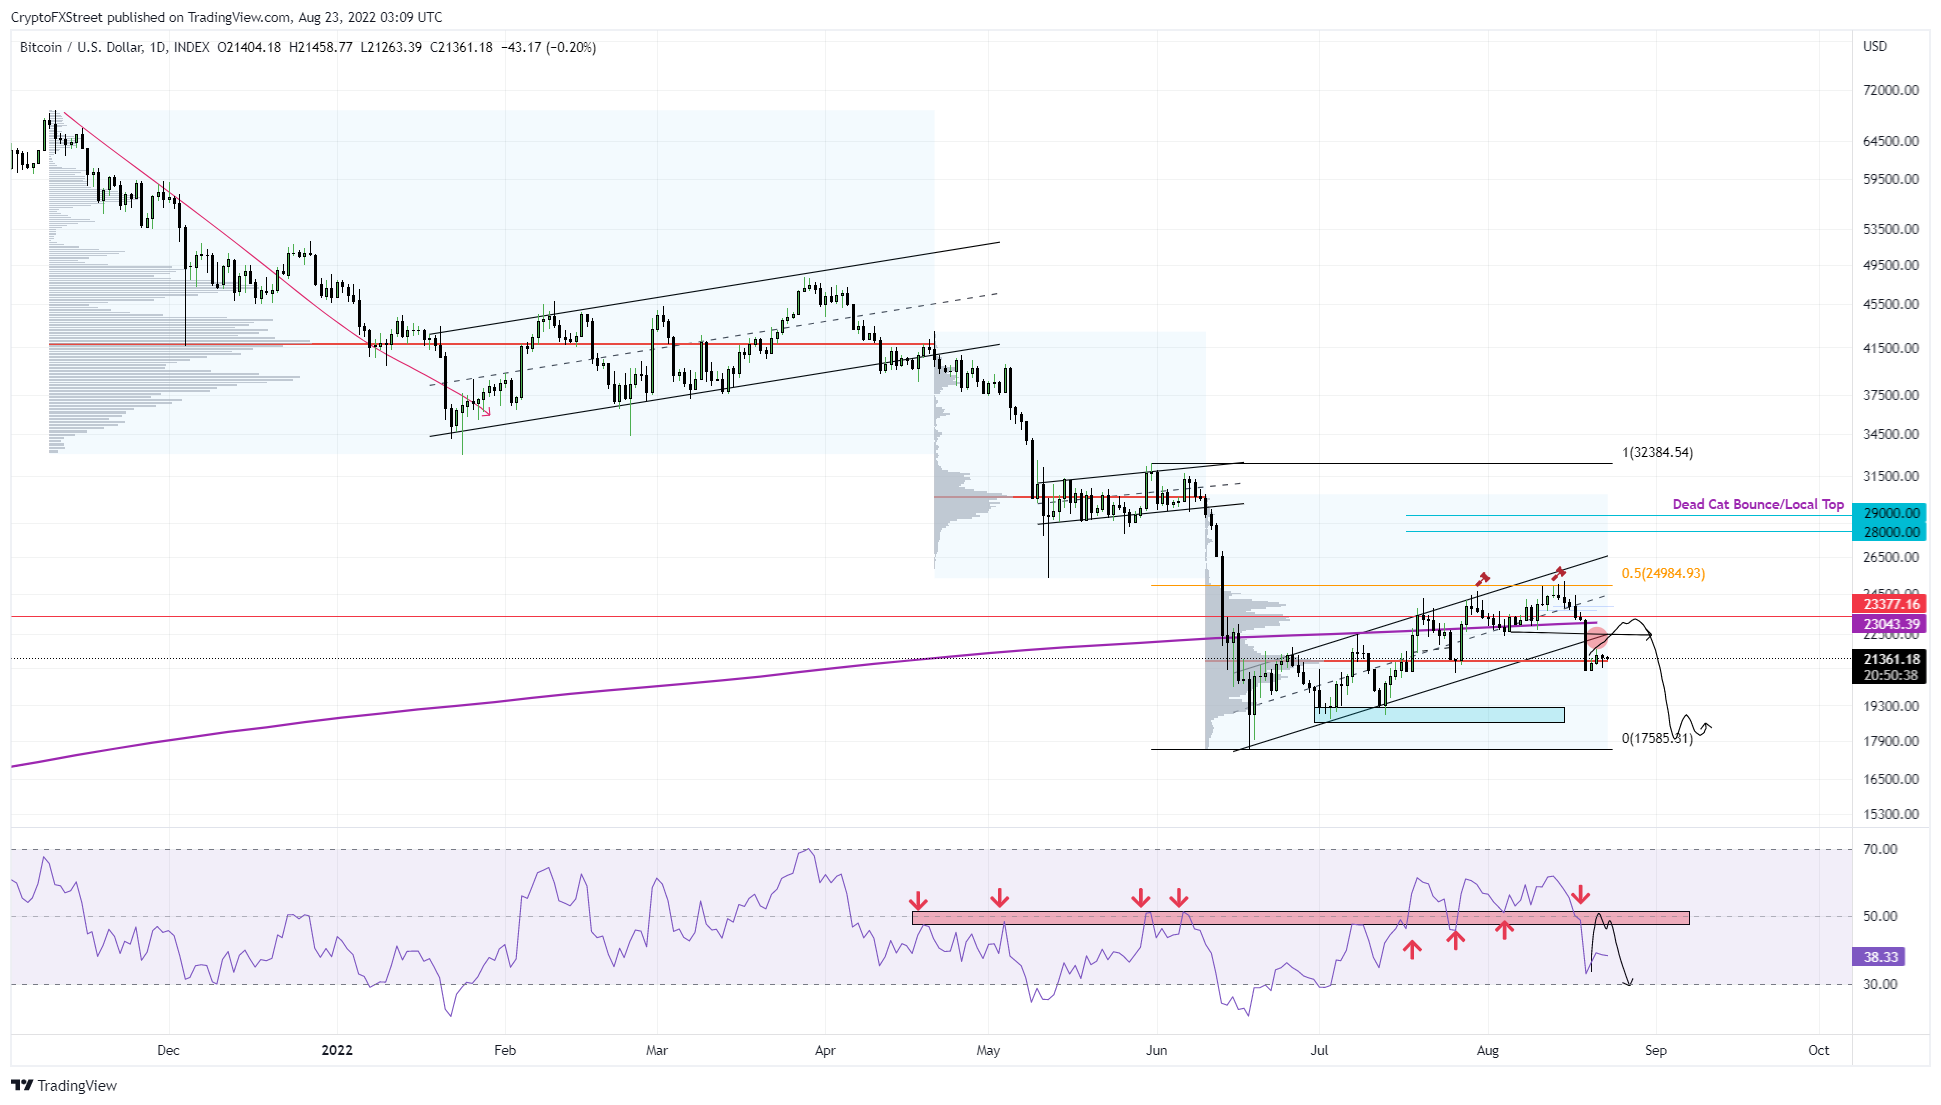
BTC/USD 1-day chart
While these scenarios explained above are mildly bearish to extremely bearish, let’s take look at the bullish outlook for BTC. This narrative will emerge if Bitcoin price rallies from its current position at $21,327 and flip the $25,000 hurdle into a support floor. Such a move will invalidate the beraish theses.
Doing this will indicate that the bulls are back and the 45% crash in the first half of June is ready to be undone. In such a case, BTC needs to clear the previous highs at $32,384 and create a new one.
This development will be the first confirmation of a bull rally. In such a case, market participants need to be on the lookout for a lower low relative to the most recent low at roughly $20,750. If successful, this move will be the one to buy and expect BTC to take off to subsequent resistance levels - $35,000, $45,000 and so on.
Author

Akash Girimath
FXStreet
Akash Girimath is a Mechanical Engineer interested in the chaos of the financial markets. Trying to make sense of this convoluted yet fascinating space, he switched his engineering job to become a crypto reporter and analyst.


