Hyperliquid price targets breakout above $20 resistance as open interest soars
- Hyperliquid price sustains gains above the 100-day EMA, eyeing a breakout above $20.00.
- The derivatives' open interest has risen nearly 14% to $625 million over the past 24 hours, signaling growing trader interest.
- A buy signal from the MACD indicator, combined with rising trading volume, strengthens HYPE's bullish outlook.

Hyperliquid (HYPE) price remains stable, holding onto recently accrued gains, while trading at $19.85 at the time of writing on Thursday. The layer-1 blockchain token tested but failed to break through resistance at $20.00 on Wednesday, forcing bulls to step back and strategize their next attempt at accelerating the uptrend.
Hyperliquid's uptrend stalls but signals continuation
Hyperliquid's price holds above the 100-day Exponential Moving Average (EMA) at $18.41, as bulls focus on stabilizing the uptrend following a recent break above a descending trendline, as illustrated on the daily chart below. The 50-day EMA at $16.88 is trending upward and aligns with a strong support zone (marked in red), which bolsters HYPE's bullish outlook.
The Moving Average Convergence Divergence (MACD) line, in blue, is above the signal line in red. This, along with the green histograms, signals the potential for bullish momentum to break above the $20.00 immediate resistance.
At the same time, the Supertrend indicator reveals a buy signal, which coincided with the breakout in the second week of April. This buy signal occurs when the indicator line crosses below the token's price, changing its color from red to green.
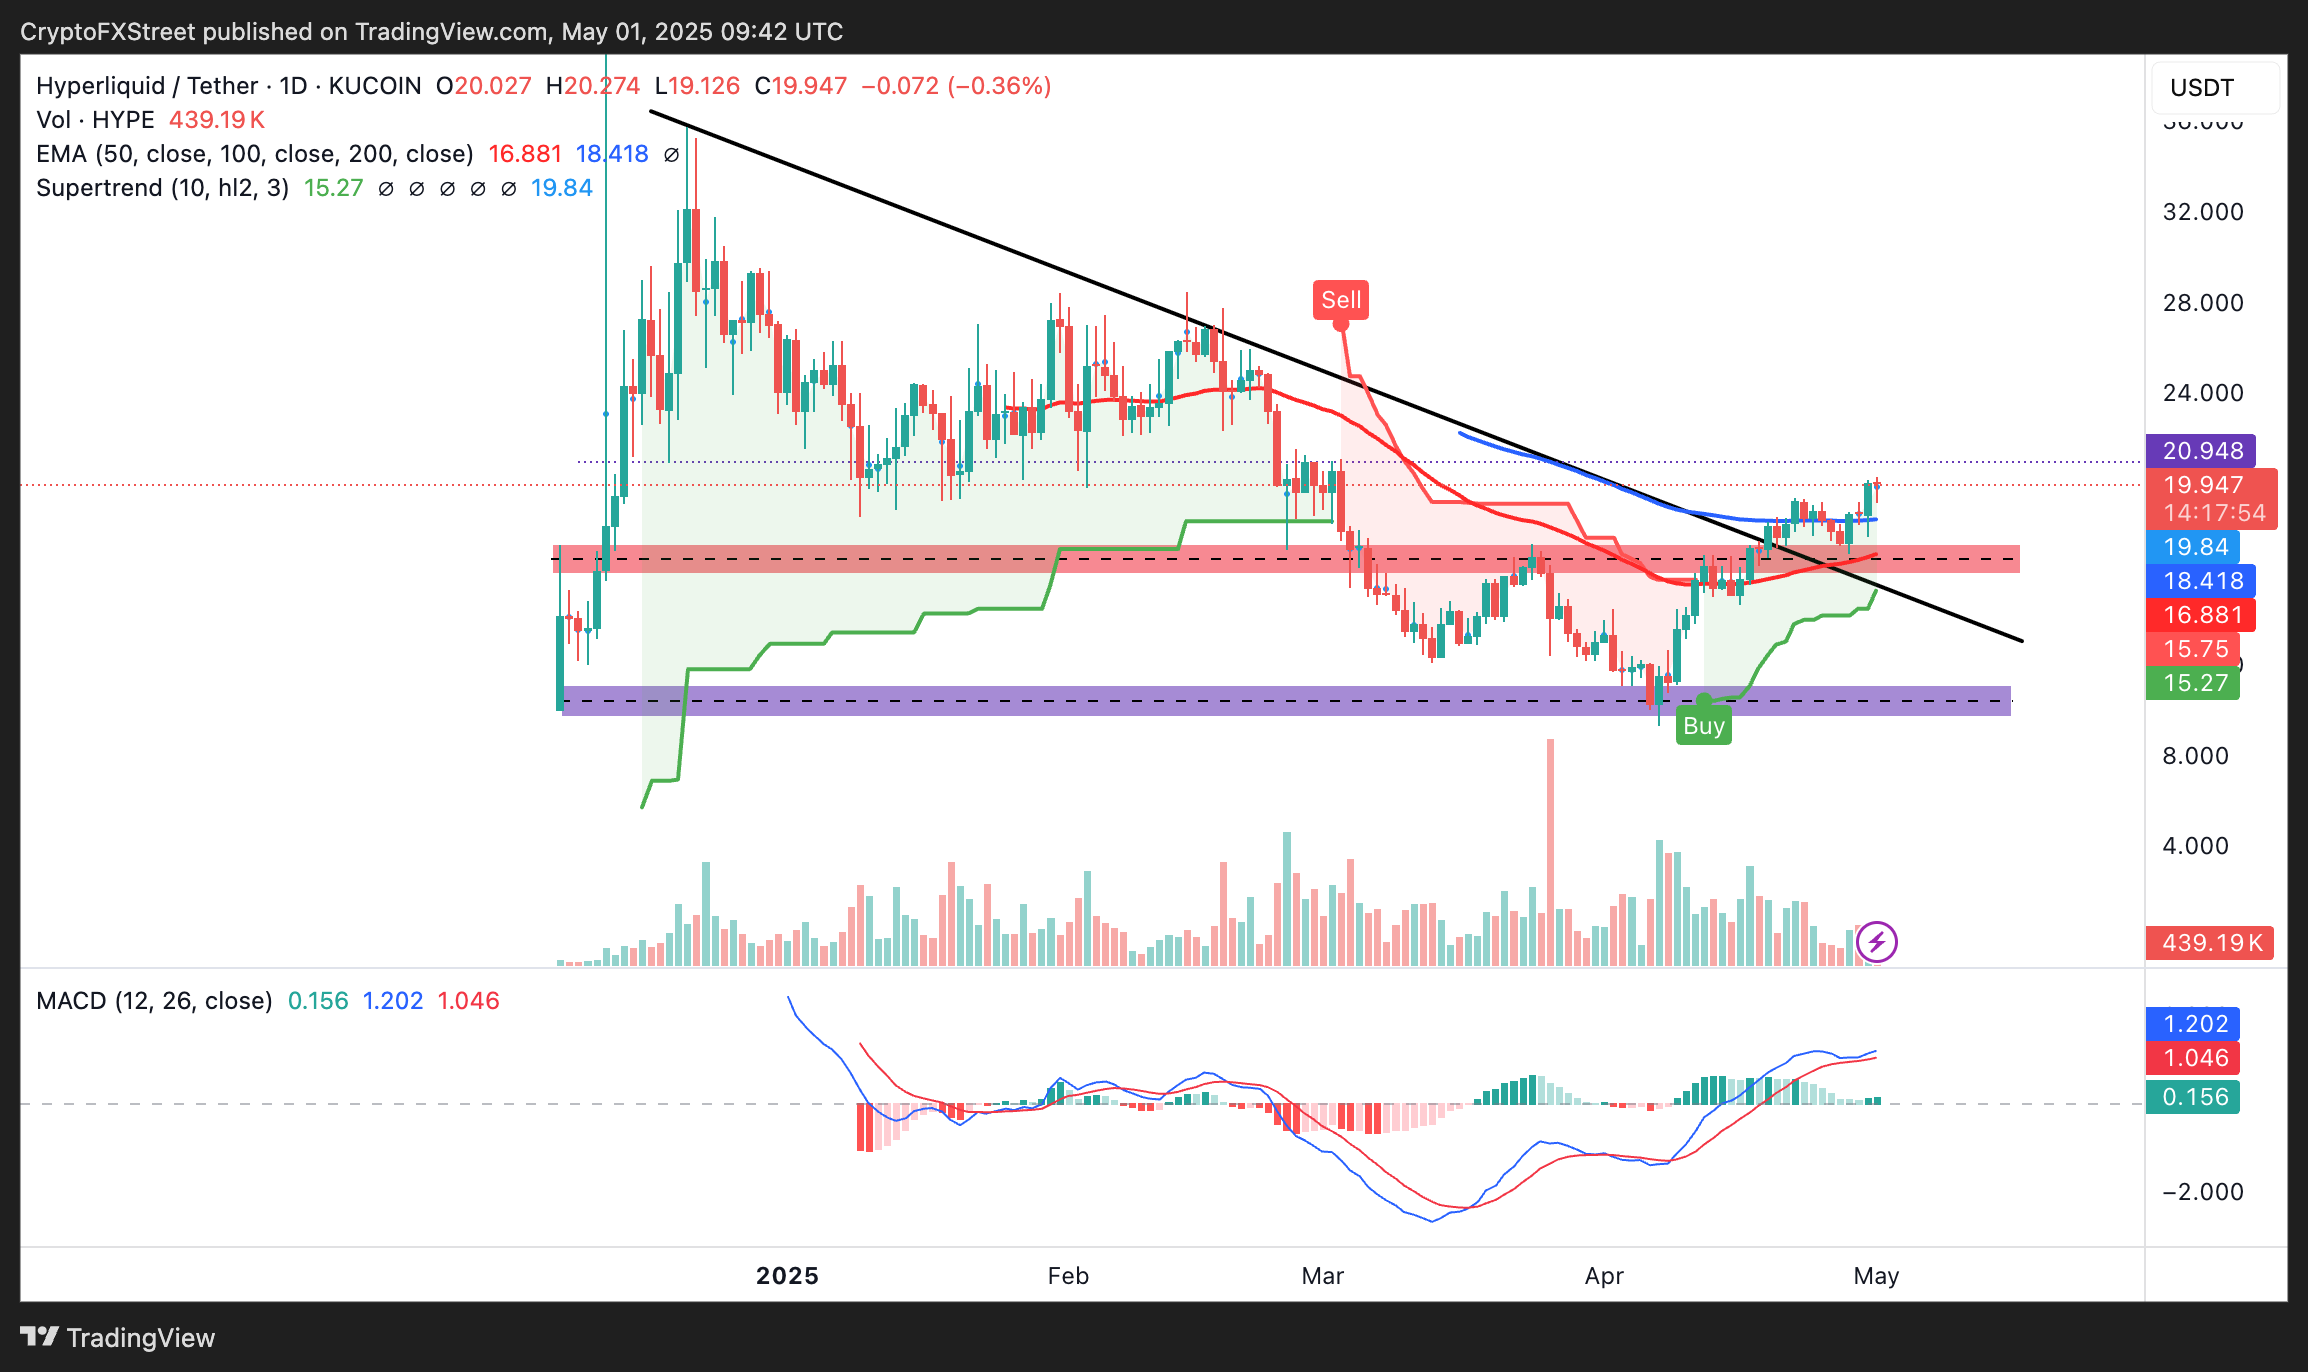
HYPE/USDT daily chart
Hyperliquid's immediate resistance lies around $20.00, aligns with the recent high of $20.94. This area was tested in February as both resistance and support. A break above this could target $24.00, another previously tested resistance-support in the first quarter.
Hyperliquid's open interest surges
Hyperliquid's derivatives open interest (OI) has increased by 13.7% to approximately $625 million in the past 24 hours, reflecting growing interest from traders. When OI increases during a minor pullback or consolidation, it often signals the opening of new long positions, which can fuel the continuation of the uptrend.
The long-to-short ratio of 1.1093 over the last 24 hours leans slightly bullish, with traders exhibiting a stronger long bias. Hyperliquid's 24-hour liquidations amount to about $135,000, with roughly $35,000 from long positions and $100,000 from shorts, indicating a short squeeze that likely supports the ongoing uptrend.
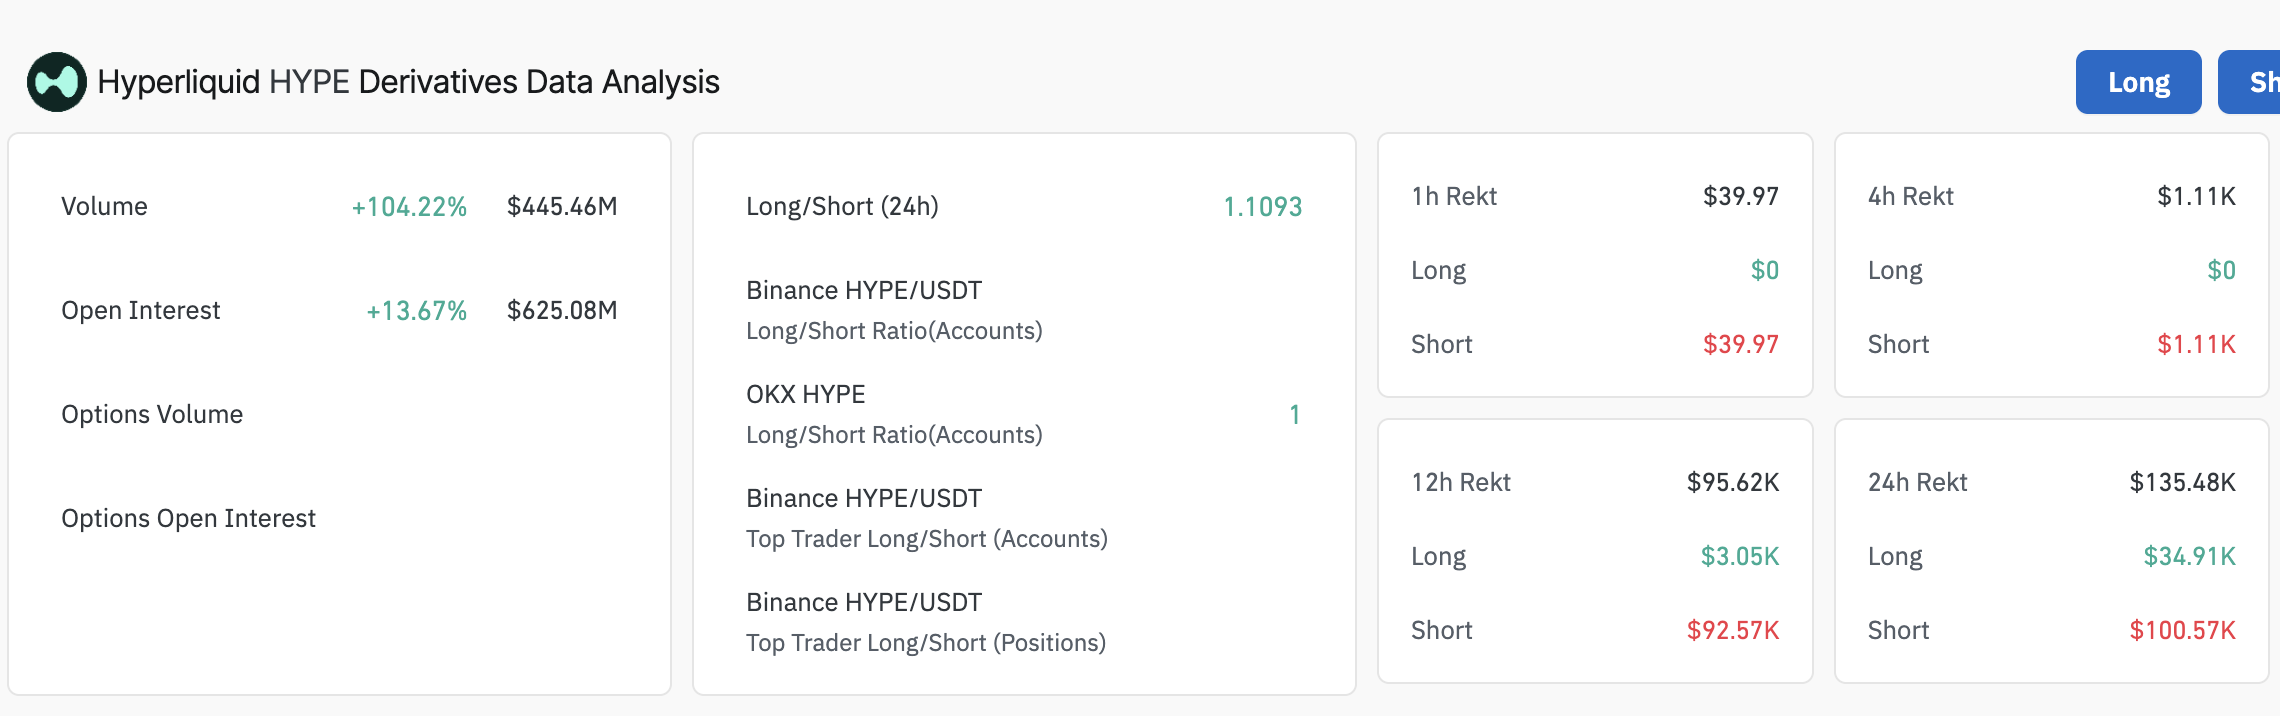
Hyperliquid's derivatives' data | Source: Coinglass
On the other hand, if HYPE fails to break above the $20.00 hurdle and instead slides below the 100-day EMA at $18.41, prices could drop toward the 50-day EMA at $16.88. This could be reflected by the MACD line crossing below the signal line, confirming a sell signal. The histograms could also turn red, hinting at losses and potentially leading HYPE to test its April 7 low at around $10.00.
Open Interest, funding rate FAQs
Higher Open Interest is associated with higher liquidity and new capital inflow to the market. This is considered the equivalent of increase in efficiency and the ongoing trend continues. When Open Interest decreases, it is considered a sign of liquidation in the market, investors are leaving and the overall demand for an asset is on a decline, fueling a bearish sentiment among investors.
Funding fees bridge the difference between spot prices and prices of futures contracts of an asset by increasing liquidation risks faced by traders. A consistently high and positive funding rate implies there is a bullish sentiment among market participants and there is an expectation of a price hike. A consistently negative funding rate for an asset implies a bearish sentiment, indicating that traders expect the cryptocurrency’s price to fall and a bearish trend reversal is likely to occur.
Author

John Isige
FXStreet
John Isige is a seasoned cryptocurrency journalist and markets analyst committed to delivering high-quality, actionable insights tailored to traders, investors, and crypto enthusiasts. He enjoys deep dives into emerging Web3 tren


