Hyperliquid Price Forecast: HYPE risks further losses as TVL, Open Interest decline
- Hyperliquid extends losses below the 100-day EMA, testing the lower boundary of a rising channel pattern on the daily chart on Thursday.
- The Total Value Locked on Hyperliquid has dropped to $2.14 billion from the all-time high of $2.78 billion on Friday.
- The USDH stablecoin launch fails to maintain interest among derivative traders.

Hyperliquid (HYPE) price is down over 6% at the time of writing on Thursday, extending the downtrend for the seventh day. The Decentralized Exchange (DEX) token risks further losses as the launch of its native USDH stablecoin fails to boost capital inflow in derivative markets or on its platform. Additionally, the technical outlook suggests bearish potential as a rising channel fallout is anticipated.
Hyperliquid’s USDH stablecoin launch struggles to lift investors' mood
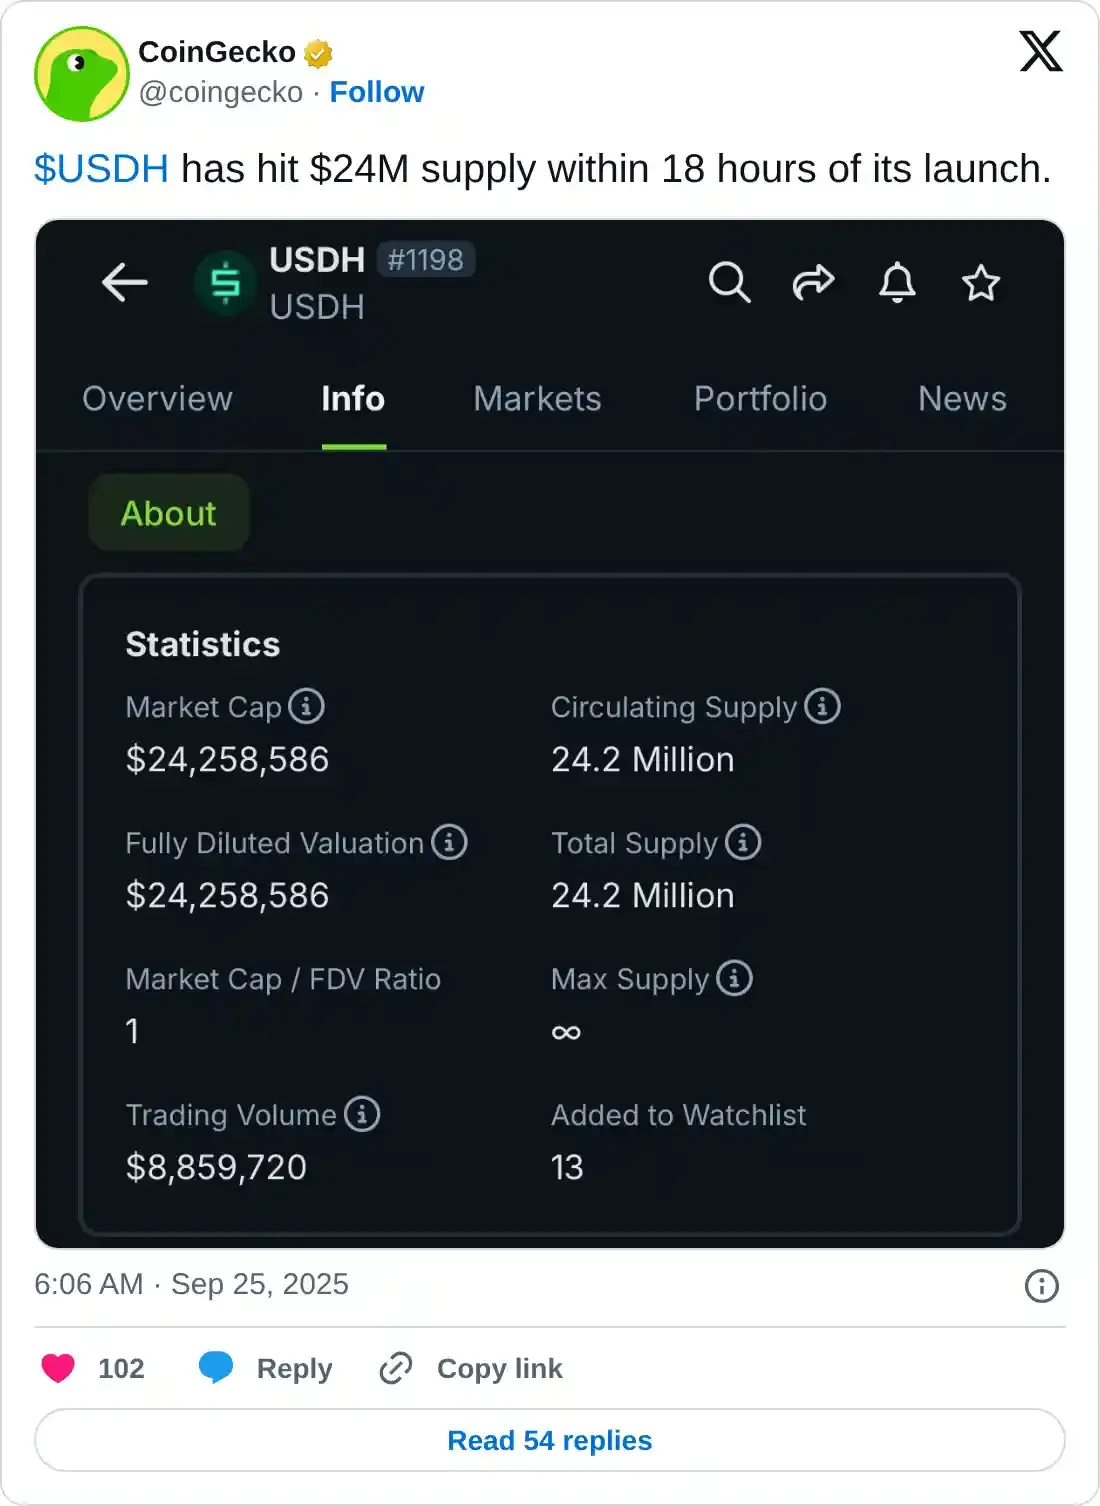
Hyperliquid-aligned USDH, powered by Native Markets, was launched on Wednesday, with total supply crossing $24 million within 18 hours of inception. Despite the 50% revenues from USDH coming to Hyperliquid’s Assistance Fund, a protocol-driven buy-back fund, the launch of this stablecoin failed to uplift traders' sentiment.
DeFiLlama data shows that the Total Value Locked (TVL) on Hyperliquid has declined to $2.14 billion on Thursday, down from the all-time high of $2.78 billion reached on Friday. This significant outflow from allocated assets indicates a sharp decline in users' interest.
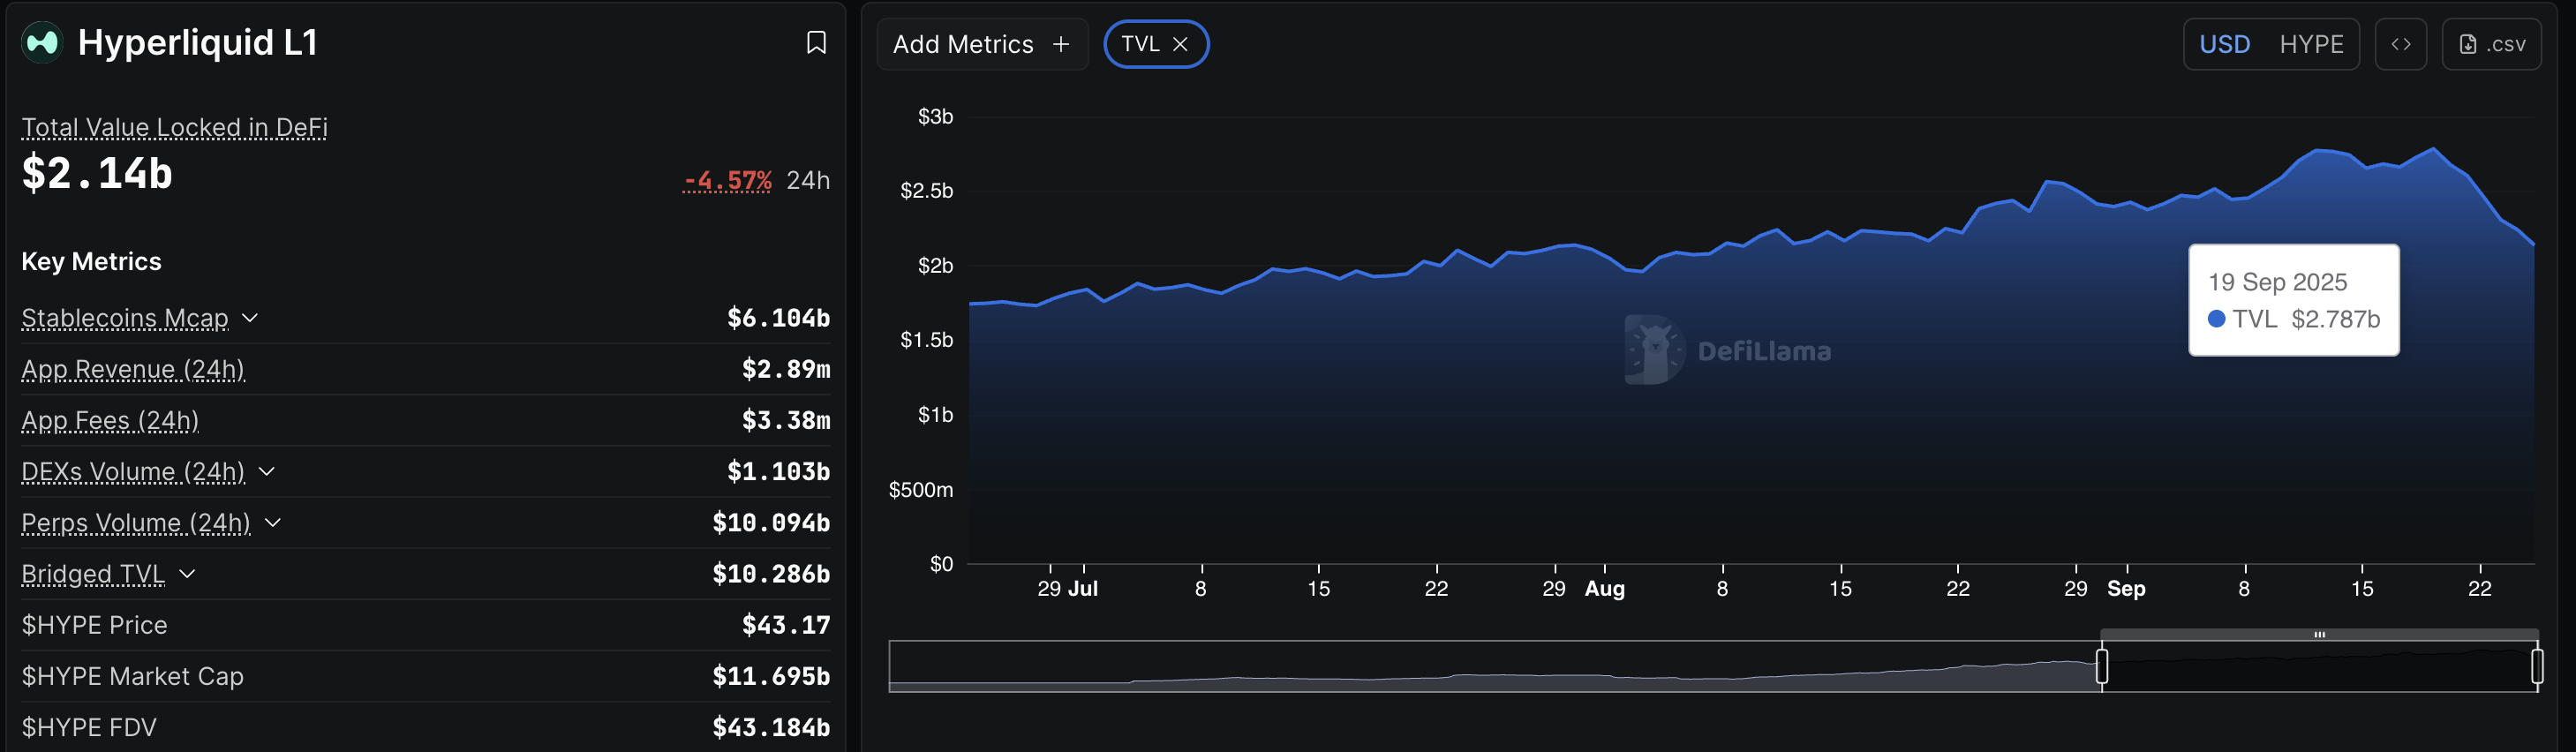
Hyperliquid TVL. Source: DeFiLlama
Validating the lowered interest, CoinGlass data reveals that the HYPE Open Interest (OI) has dropped by 3.09% in the last 24 hours, reaching $2.13 billion. This decline in OI suggests that risk-off sentiment is brewing among traders.
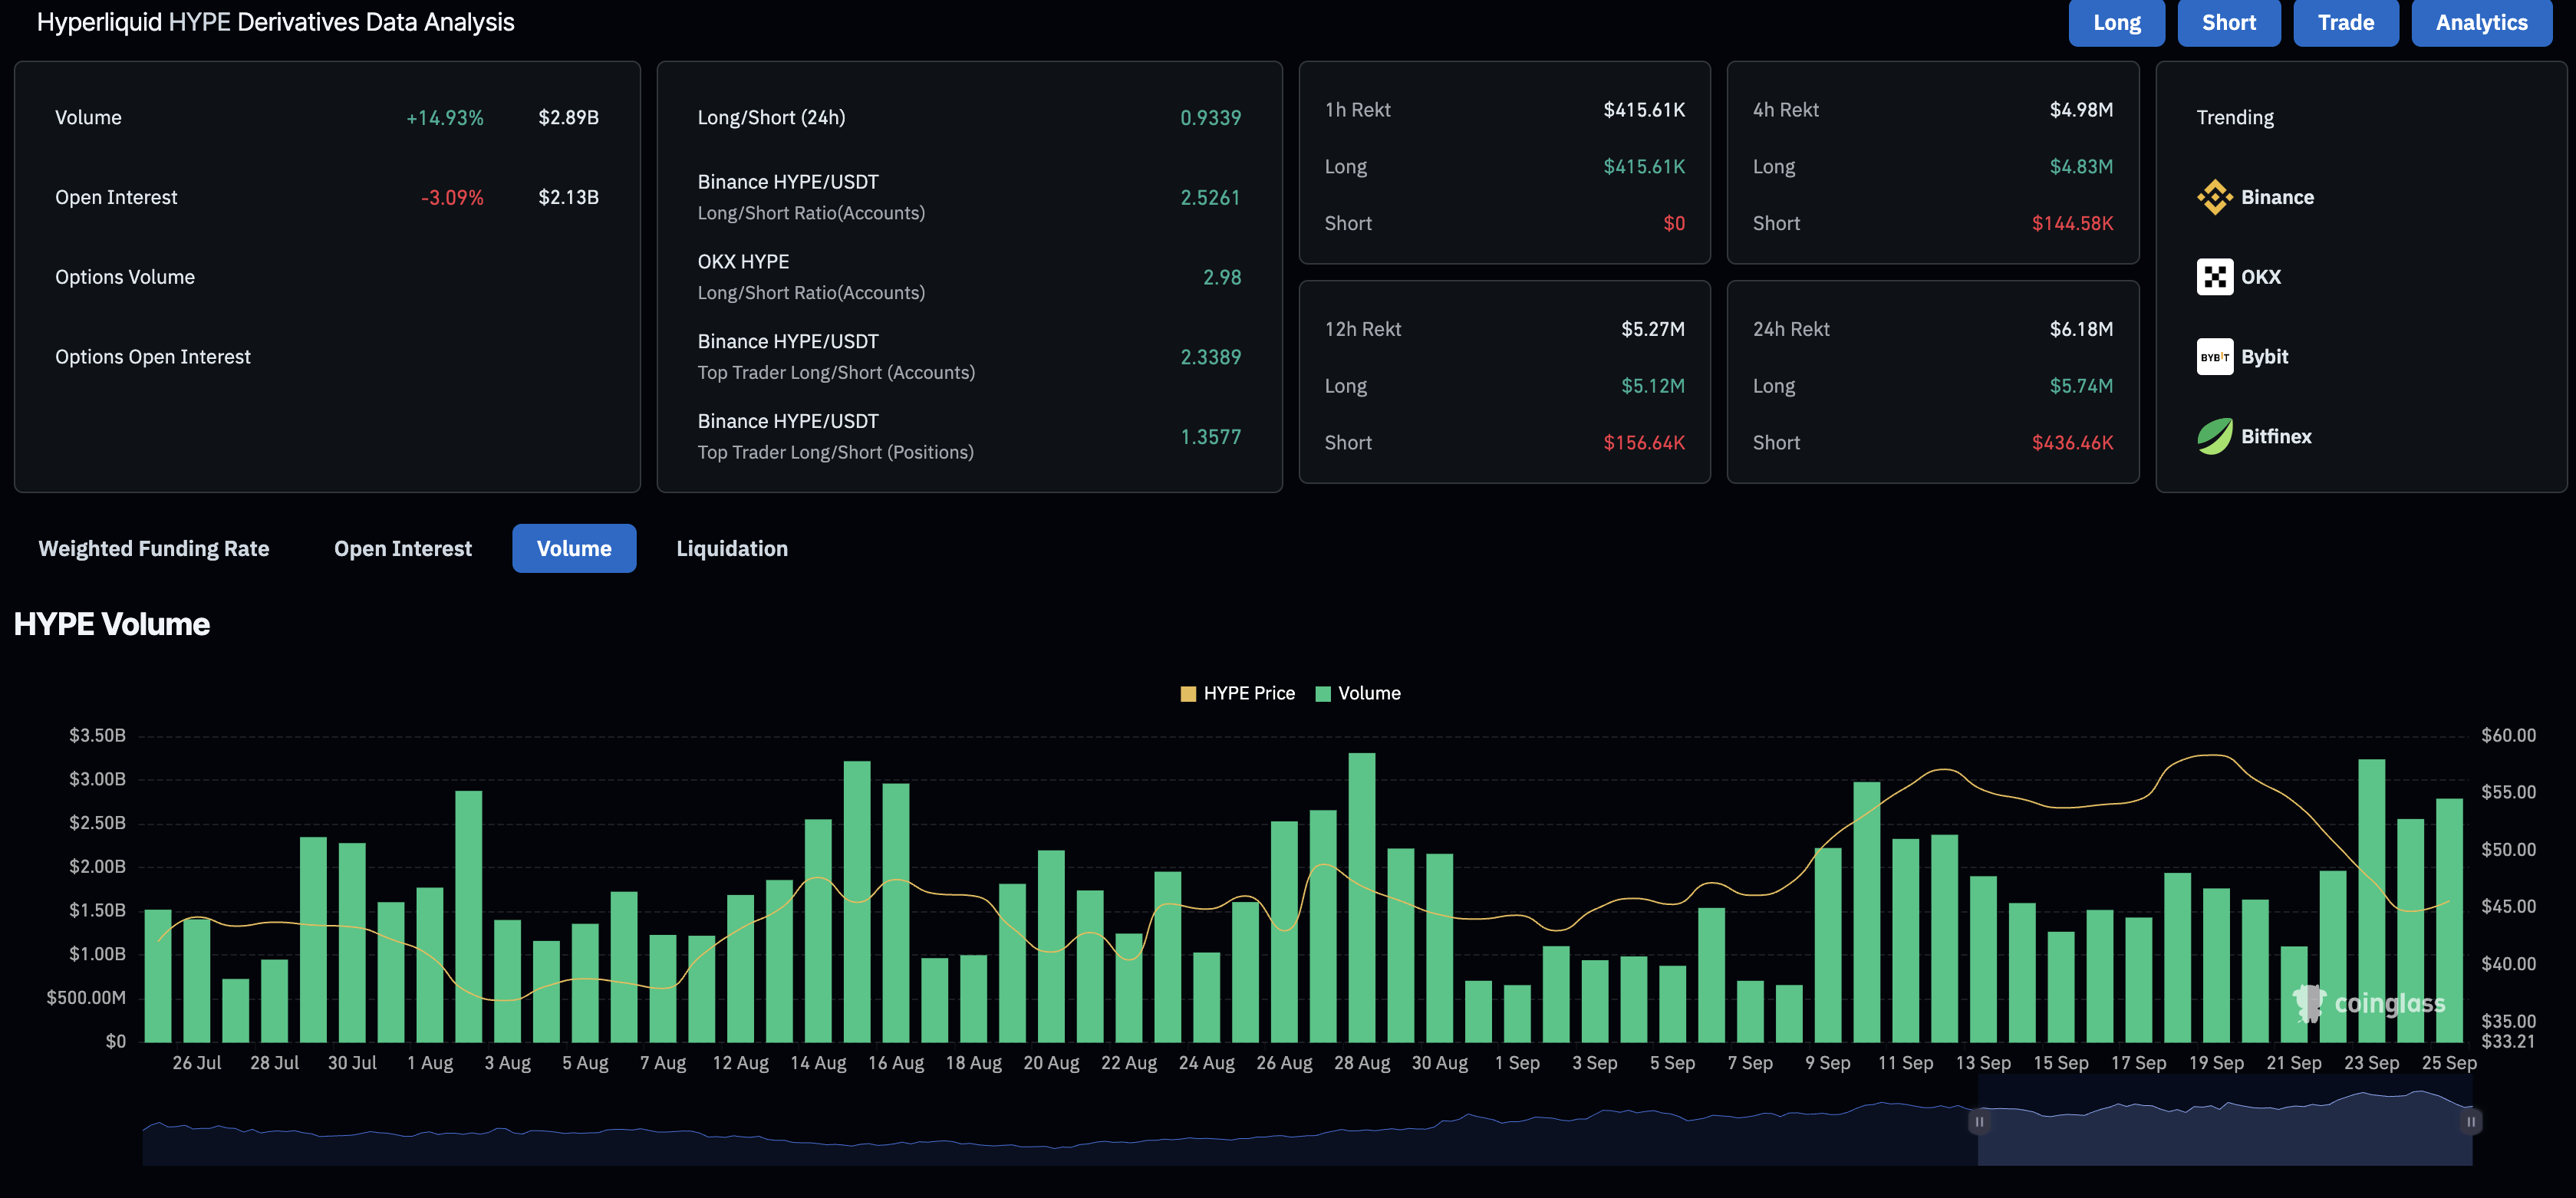
Hyperliquid derivatives data. Source: CoinGlass
HYPE risks further losses amid an impending channel fallout
Hyperliquid trades below the 100-day Exponential Moving Average (EMA) at $43.93, risking a fallout from a rising channel pattern on the daily chart. This pattern is formed by a resistance trendline connecting the peaks of June 16 and July 22, alongside a support trendline connecting the close of May 29 and August 2.
If HYPE marks a decisive close below this support trendline at $42.50, it would confirm the channel fallout, potentially targeting the 200-day EMA at $36.95.
The declining trend of the Moving Average Convergence Divergence (MACD) hits the zero line after Saturday’s crossover with its signal line on the daily chart. A steady rise in the histogram bars below the zero line indicates an increase in bearish momentum.
Furthermore, the Relative Strength Index (RSI) reads 36 on the same chart, inching closer to the oversold zone as selling pressure remains elevated.
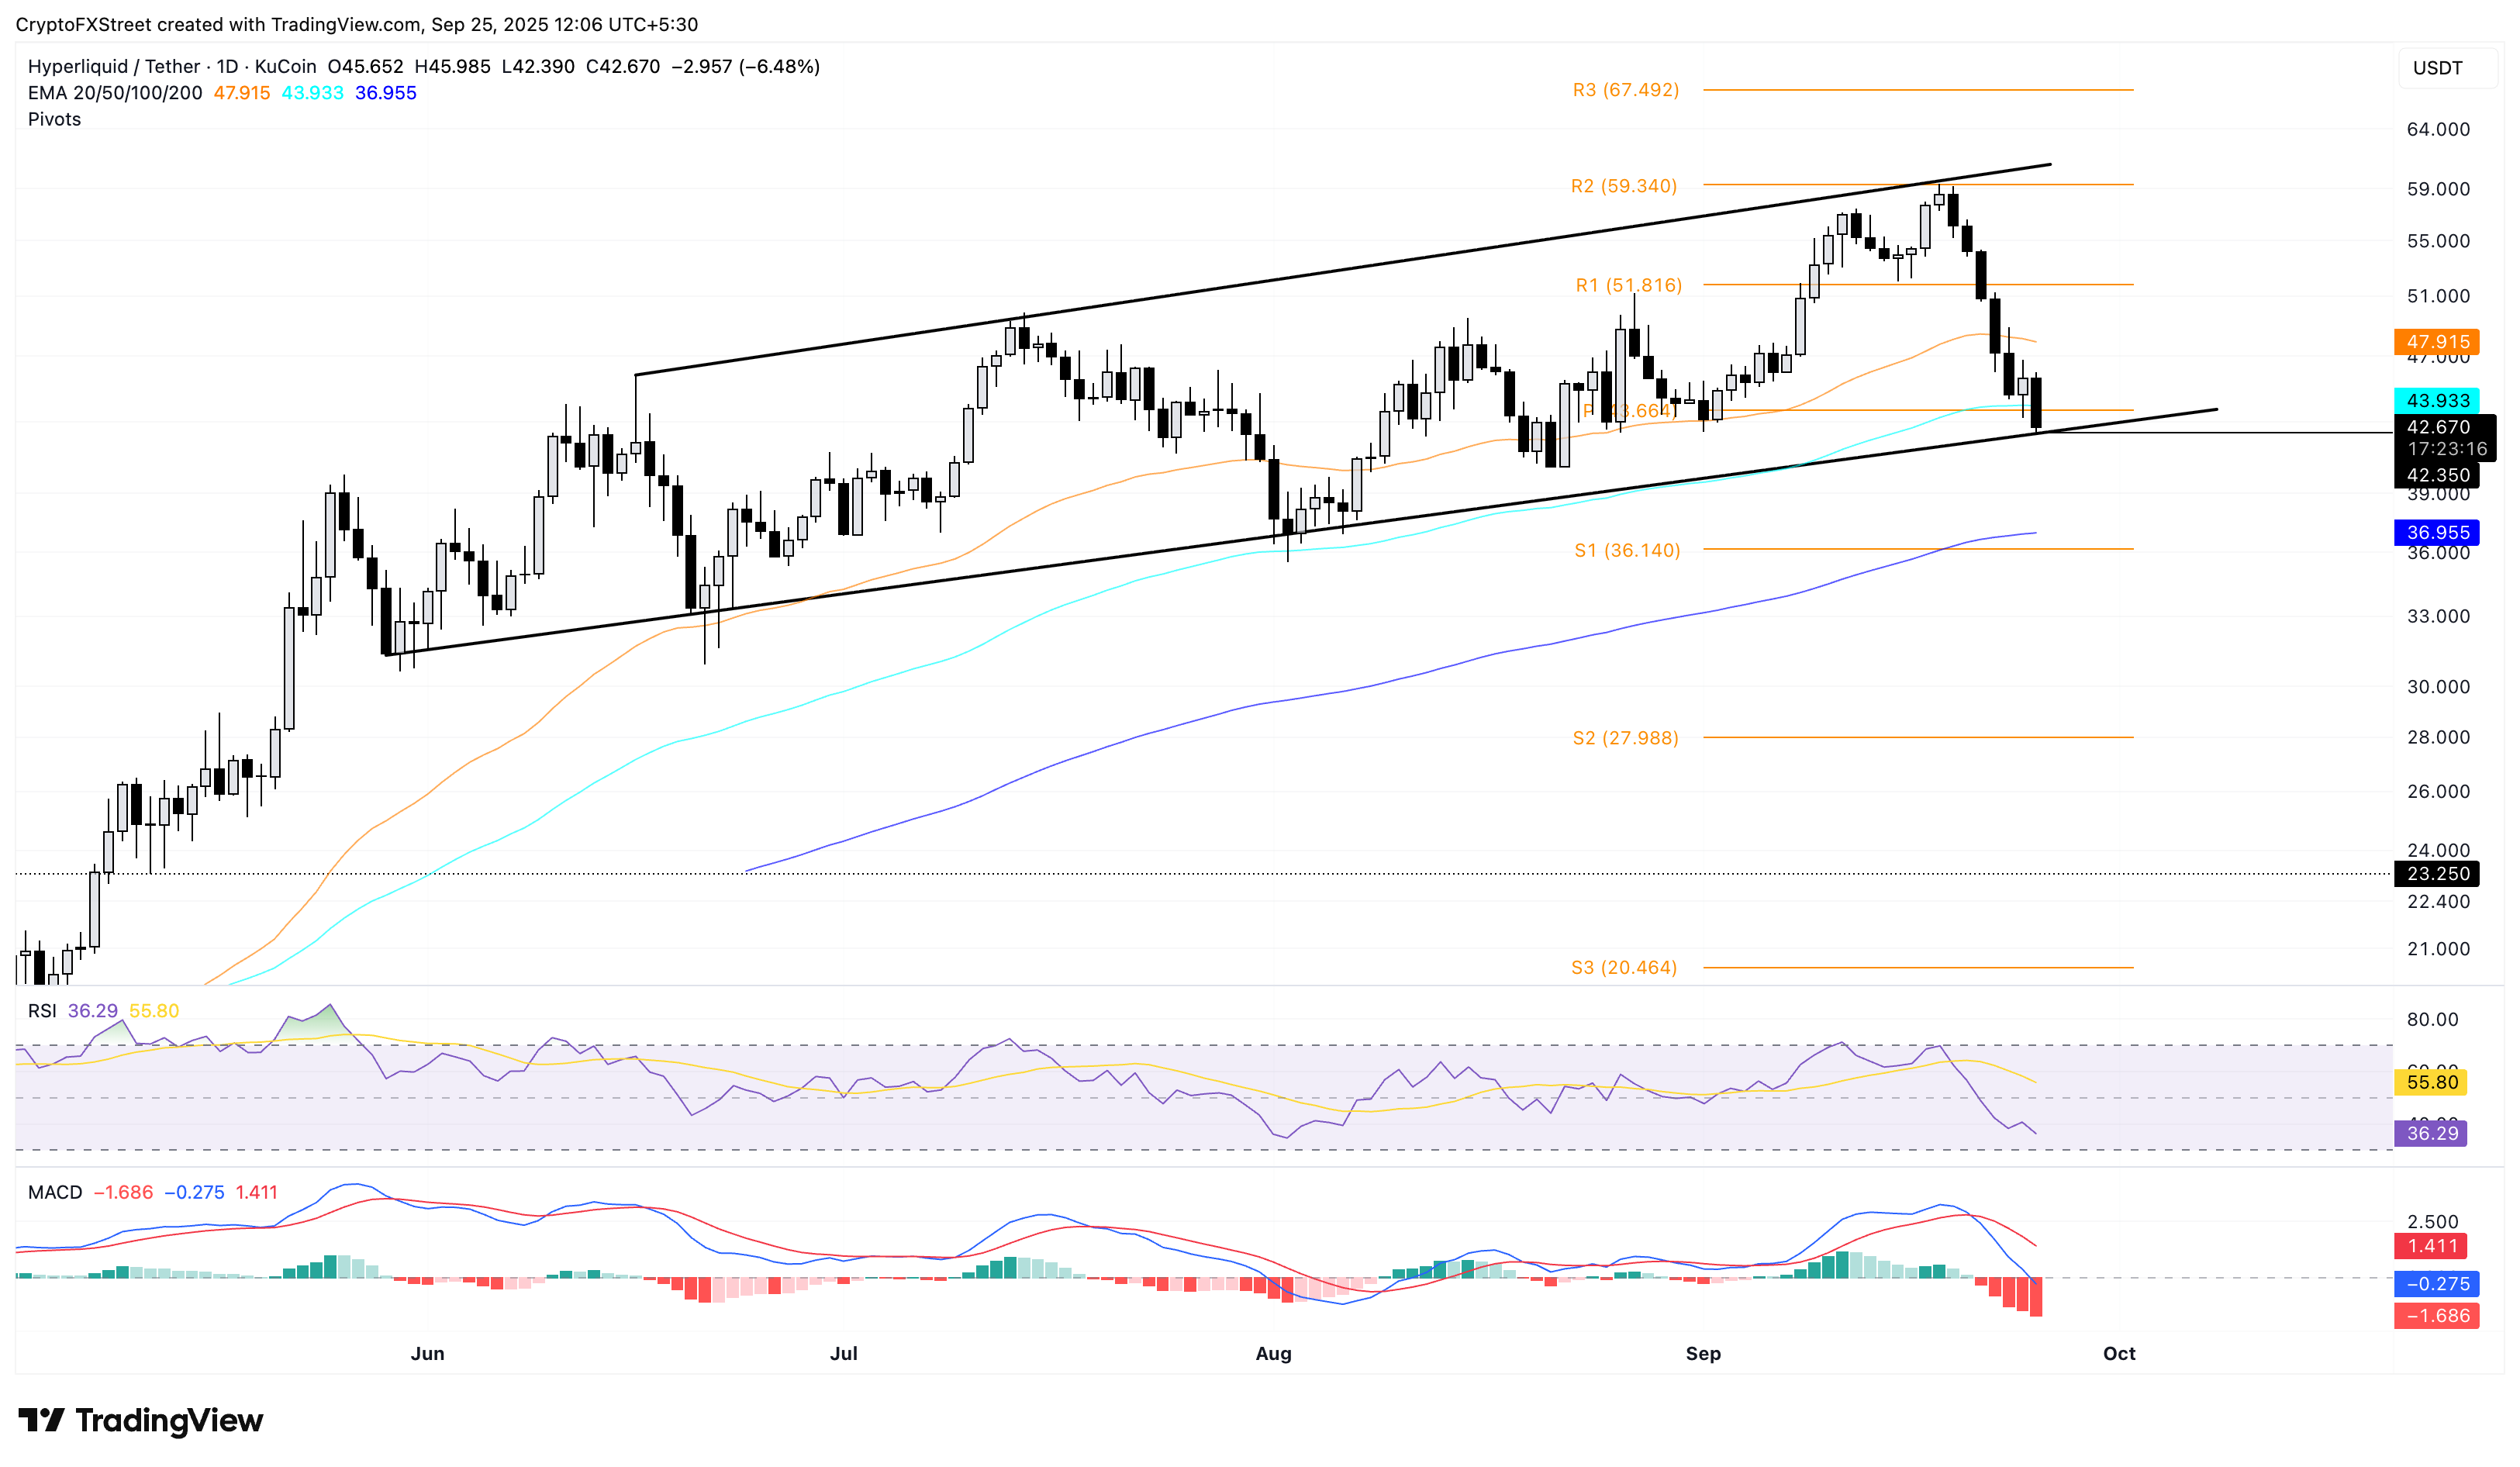
HYPE/USDT daily price chart.
Looking up, a potential bounce back from the support trendline could test the 50-day EMA at $47.91.
Author

Vishal Dixit
FXStreet
Vishal Dixit holds a B.Sc. in Chemistry from Wilson College but found his true calling in the world of crypto.




