Hyperliquid Price Forecast: HYPE reclaims $42 on rising DeFi TVL, retail demand
- Hyperliquid extends recovery as optimism for a bullish fourth quarter returns.
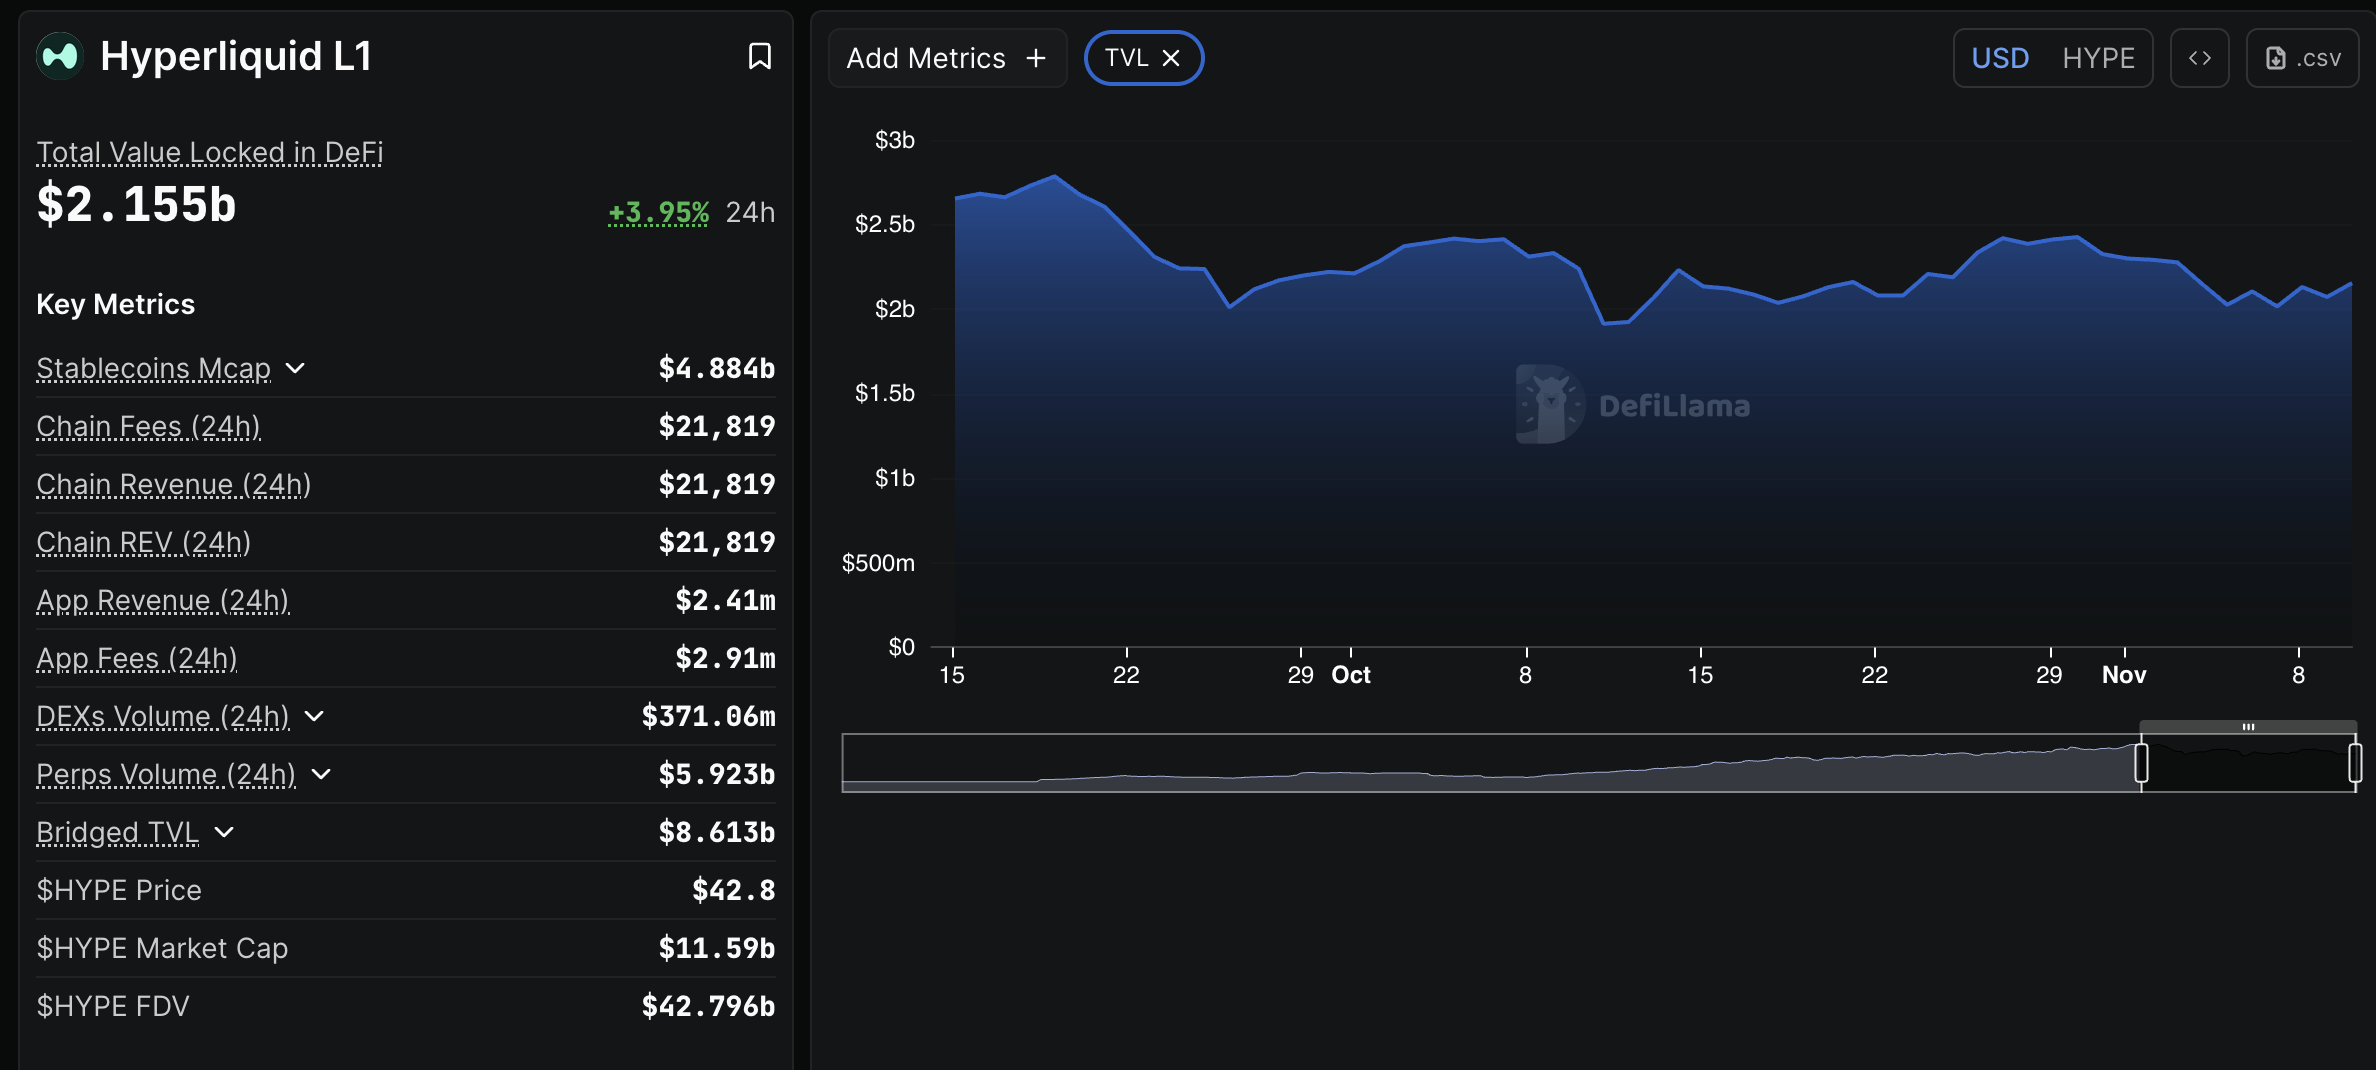
- HYPE’s DeFi TVL increases 4% over the past 24 hours to $2.15 billion as investor confidence improves.
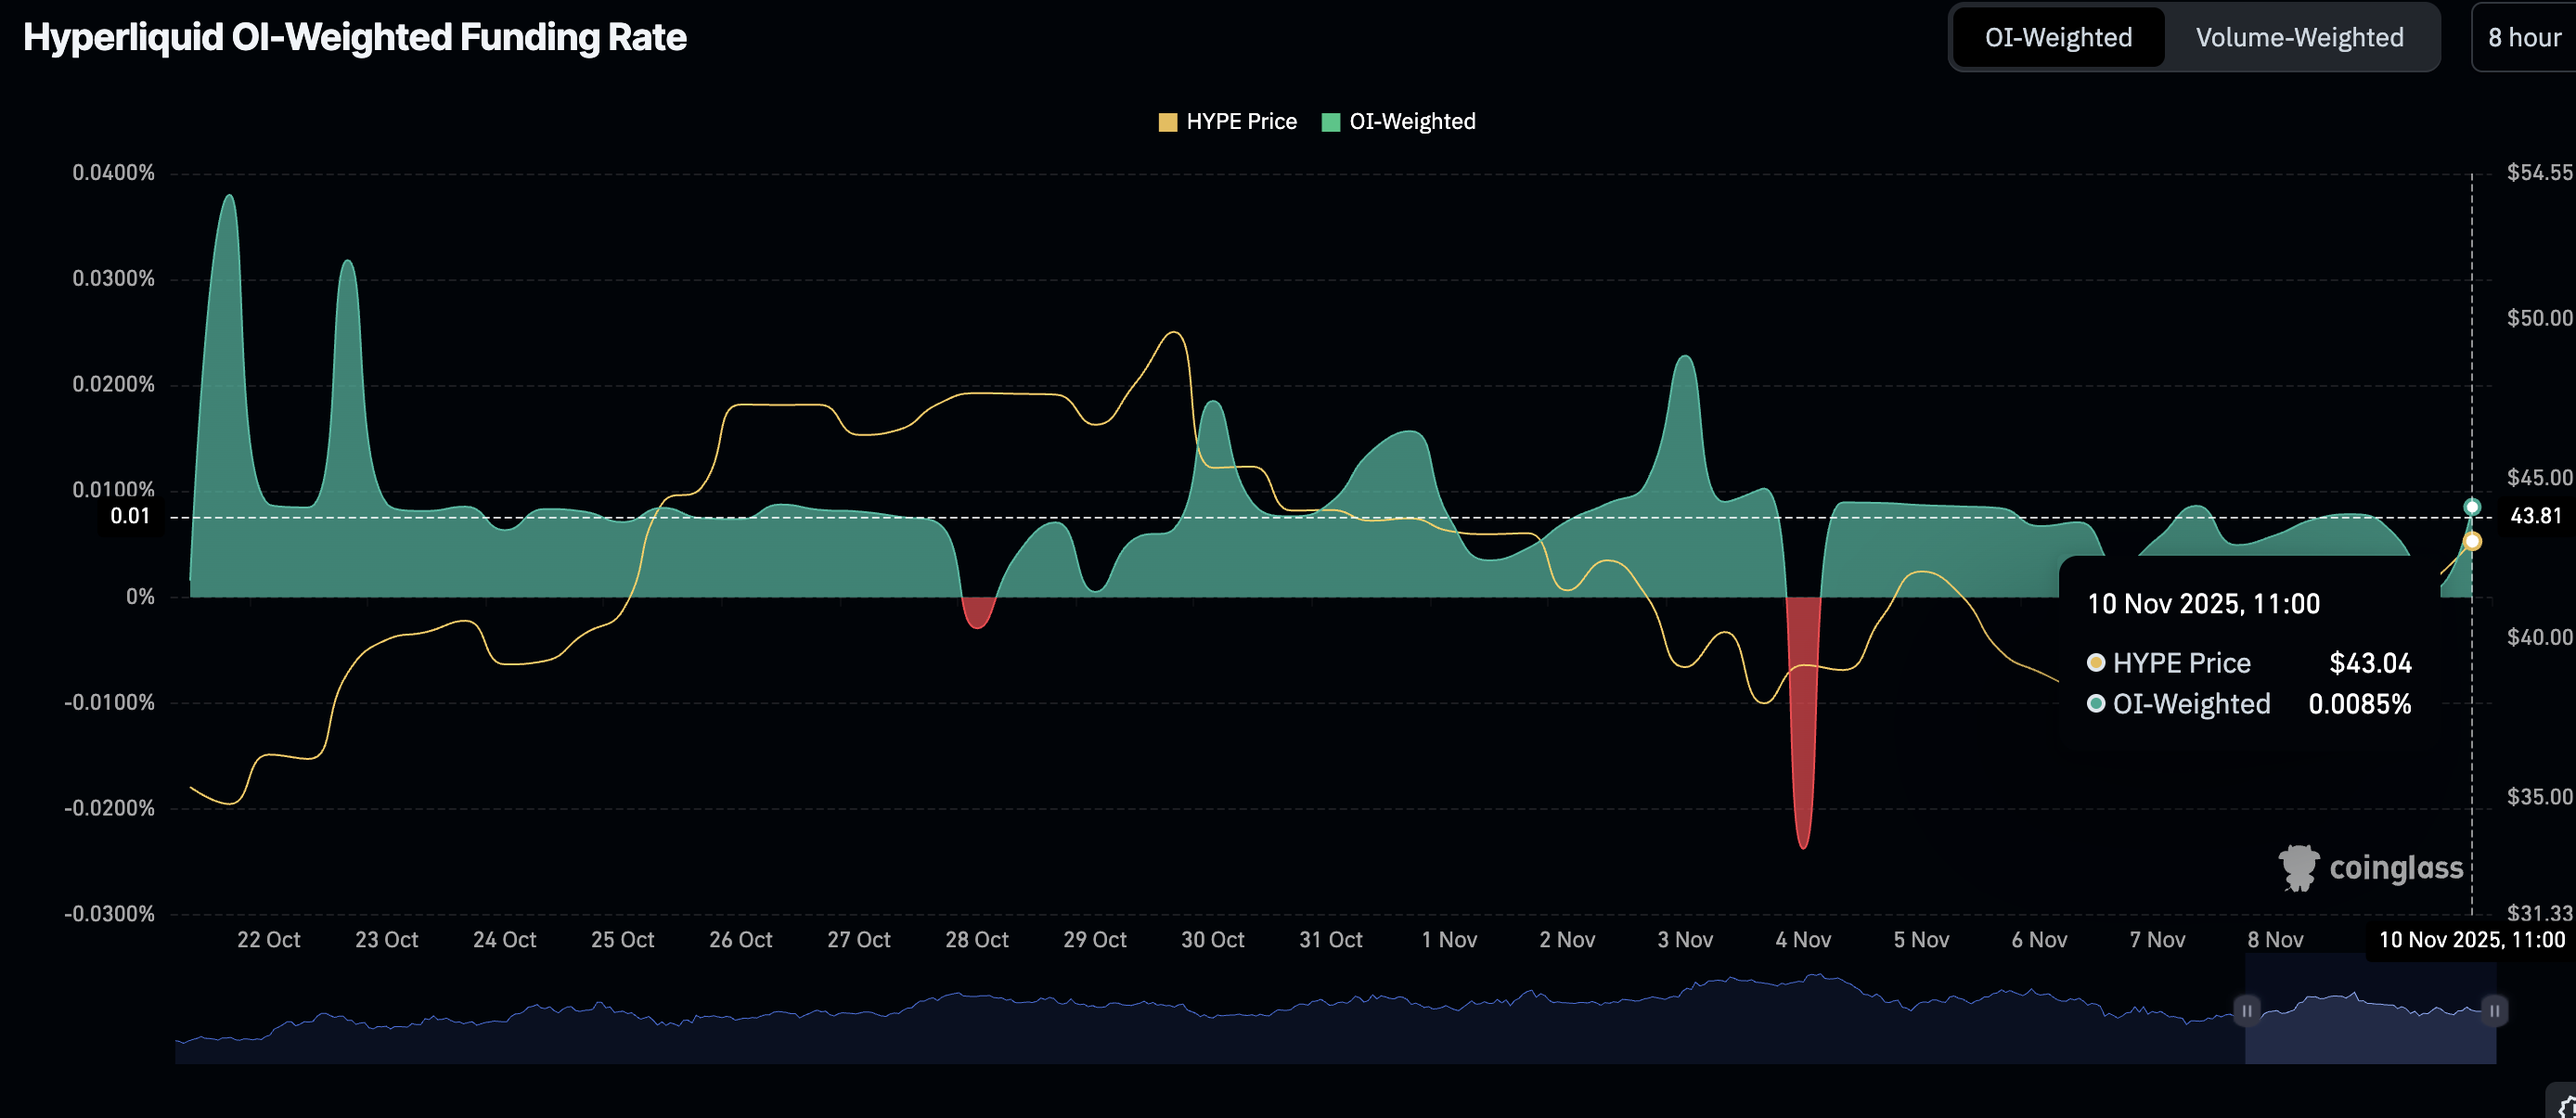
- Retail demand for HYPE shows signs of a strong comeback, with the Open Interest-weighted funding rate rising to 0.0085%.

Hyperliquid (HYPE) is on the verge of a bullish breakout, rising above $42.00 at the time of writing on Monday. The perpetual Decentralised Exchange (DEX) native token mirrors a bullish wave spreading across the cryptocurrency market after the United States (US) Senate passed a bill to end the ongoing record-breaking government shutdown.
Hyperliquid DeFi TVL recovers backing risk-on sentiment
Hyperliquid’s Decentralized Finance (DeFi) Total Value Locked (TVL) is up by nearly 4% over the last 24 hours to $2.15 billion, according to DefiLlama.
Investors often increase their exposure to staking protocols within the ecosystem when they have confidence in the token’s ability to sustain short-term recovery. Higher staking volumes reduce the potential selling pressure in the open market, creating a suitable environment for a sustainable uptrend.
Traders are increasingly piling into Hyperliquid long positions, as evidenced by the Open Interest-Weighted Funding Rate metric’s lift to 0.0085% on Monday from 0.0060% the previous day. If risk-on sentiment steadies in the coming days, encouraging investors to increase their exposure, HYPE may sustain recovery, targeting highs above $50.00 in the short to medium term.
Technical outlook: Assessing Hyperliquid’s bullish outlook
Technical analysis shows that bulls are slowly regaining control as Hyperliquid’s price rises alongside other cryptocurrencies. The token is trading marginally below the confluence of the 50-day and 100-day Exponential Moving Averages (EMAs) at around $42.64 at the time of writing on Monday.
The Relative Strength Index (RSI) is at 50, poised to confirm a bullish crossover on the same daily chart, increasing the odds of a steady short-term uptrend. Higher RSI readings would support HYPE’s bullish outlook.
Traders should also watch for a potential buy signal from the Moving Average Convergence Divergence (MACD) indicator. Such a signal occurs when the blue line crosses above the red signal line, encouraging investors to increase their risk exposure.
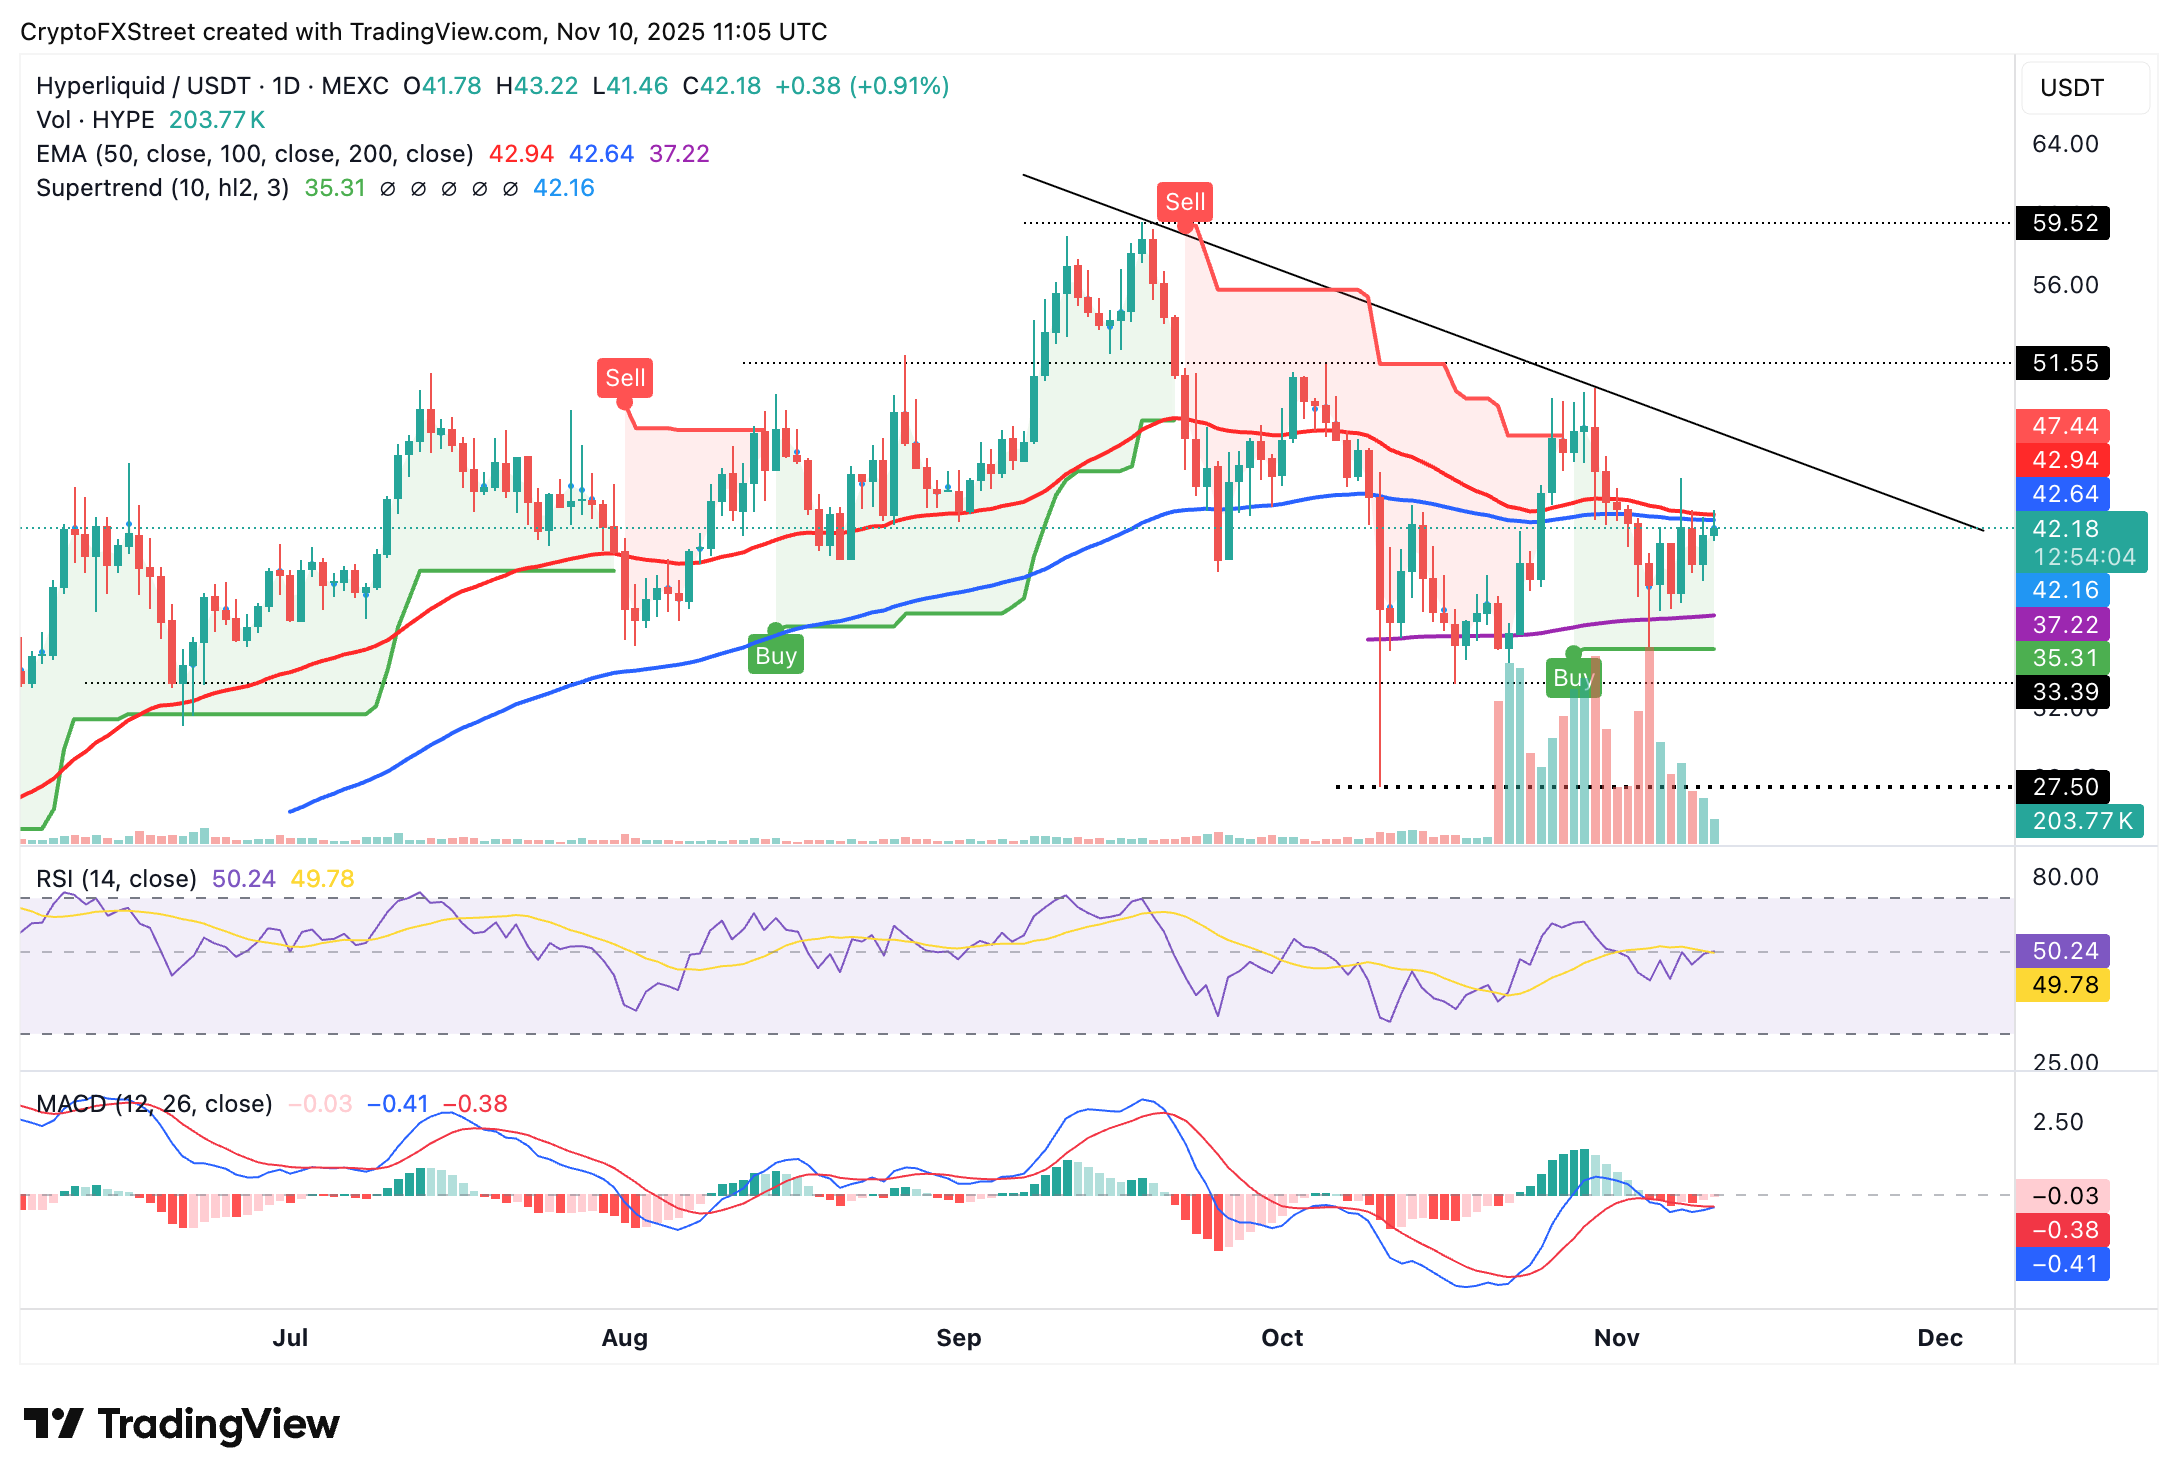
The SuperTrend indicator has flipped below Hyperliquid’s price, marking a potential shift from bearish to bullish. Still, a correction may occur if HYPE fails to breach the confluence resistance at $42.64. The 200-day EMA at $37.22 will serve as the next primary support if a sell-off ensues below the critical $40.00 level.
Open Interest, funding rate FAQs
Higher Open Interest is associated with higher liquidity and new capital inflow to the market. This is considered the equivalent of increase in efficiency and the ongoing trend continues. When Open Interest decreases, it is considered a sign of liquidation in the market, investors are leaving and the overall demand for an asset is on a decline, fueling a bearish sentiment among investors.
Funding fees bridge the difference between spot prices and prices of futures contracts of an asset by increasing liquidation risks faced by traders. A consistently high and positive funding rate implies there is a bullish sentiment among market participants and there is an expectation of a price hike. A consistently negative funding rate for an asset implies a bearish sentiment, indicating that traders expect the cryptocurrency’s price to fall and a bearish trend reversal is likely to occur.
Author

John Isige
FXStreet
John Isige is a seasoned cryptocurrency journalist and markets analyst committed to delivering high-quality, actionable insights tailored to traders, investors, and crypto enthusiasts. He enjoys deep dives into emerging Web3 tren


