Hyperliquid Price Forecast: HYPE poised for $40 breakout as staking balance drops 2%
- Hyperliquid remains above the 200-day EMA as bulls push for highs beyond $40.00.
- HYPE’s staking balance drops 2% over the last 24 hours to $2 billion.
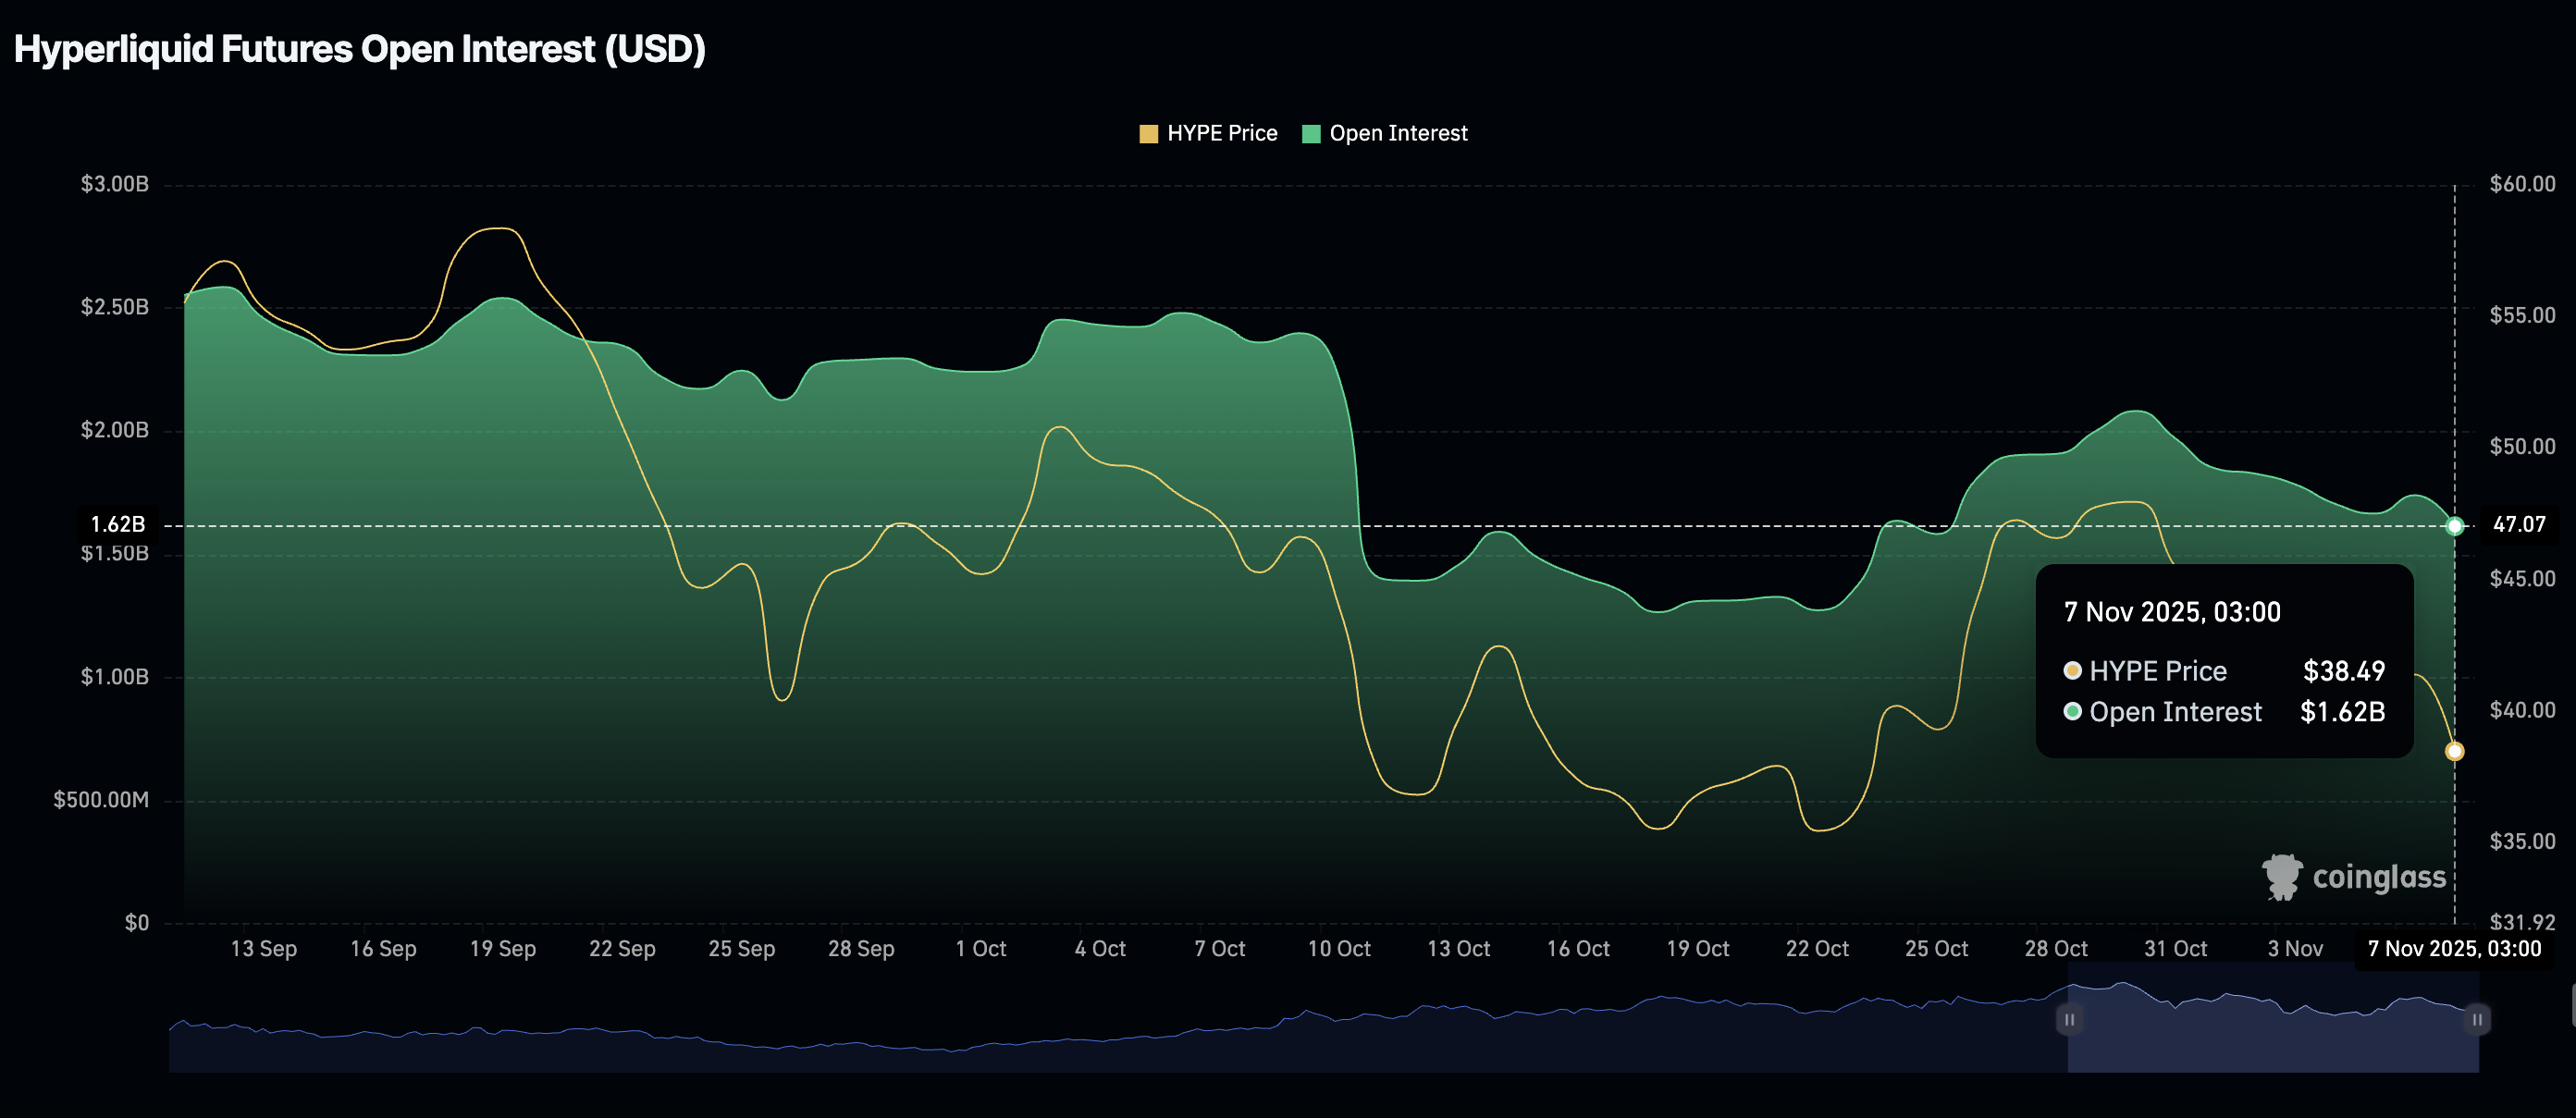
- Retail demand for HYPE dwindles as the futures Open Interest extends its decline to $1.62 billion.

Hyperliquid (HYPE) is battling to hold short-term support at $37.00 at the time of writing on Friday, as a bearish wave sweeps across the cryptocurrency market. The perpetual decentralized exchange (DEX) token has declined from an intraday high of $40.75, reflecting a sticky bearish sentiment.
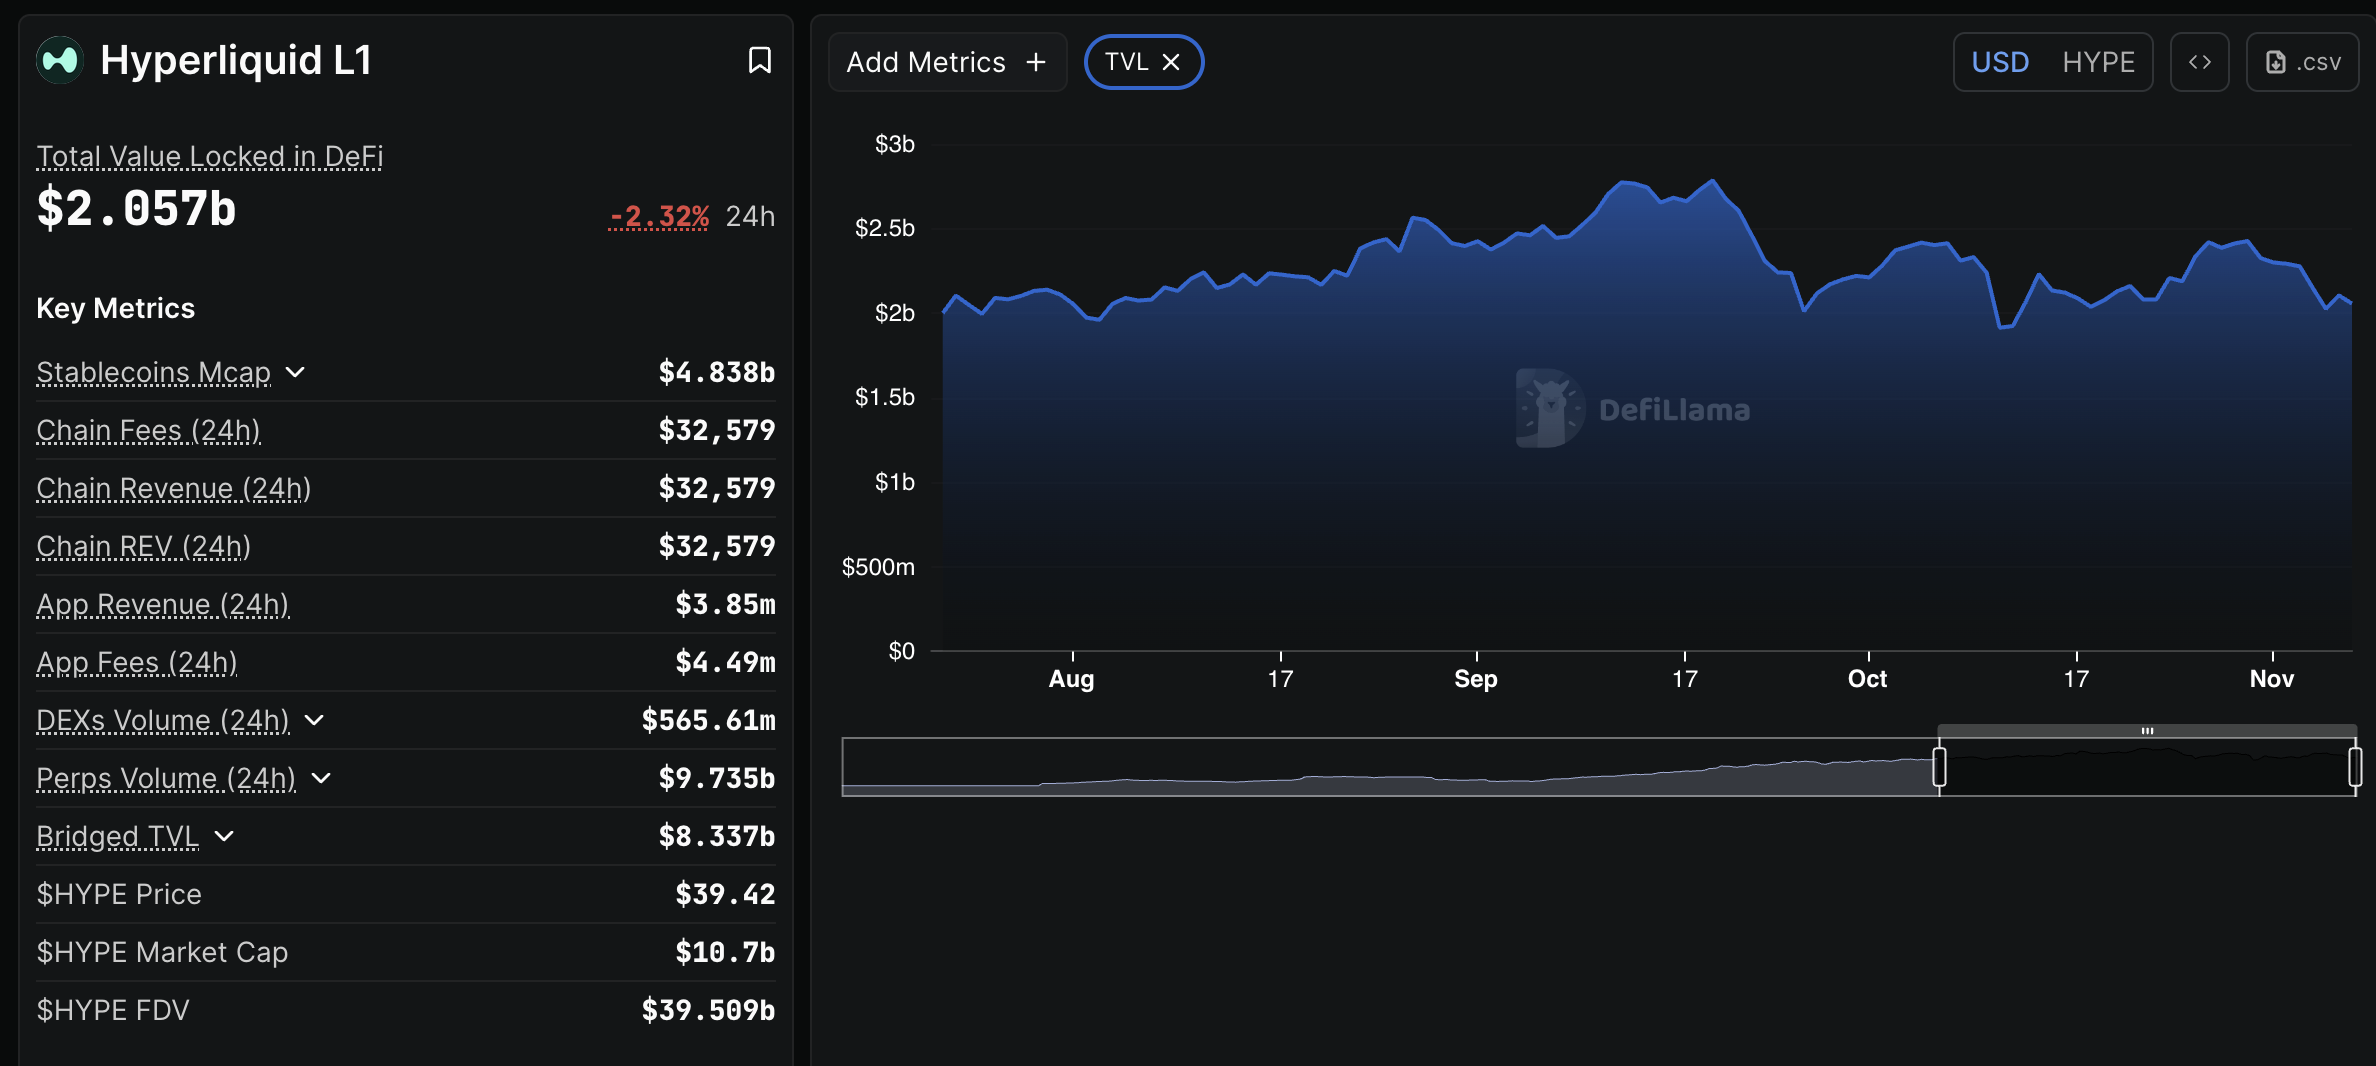
Hyperliquid staking dip signals rising selling pressure
Hyperliquid is facing increasing selling pressure as its staking balance falls, according to DefiLlama’s Decentralized Finance (DeFi) Total Value Locked (TVL), which decreased by 2.32% over the last 24 hours to $2 billion.
Pulling assets from staking smart contracts within the ecosystem suggests that investors are losing confidence in HYPE’s ability to sustain short-term recovery.
Meanwhile, retail interest in HYPE has taken a hit since October 30, when the futures Open Interest (OI) averaged $2 billion. The OI, representing the notional value of outstanding futures contracts, stands at $1.62 billion on Friday.
CoinGlass data shows that Hyperliquid’s OI hit a record high of $2.59 billion in mid-September, marking a local top of $59.52. If risk-off sentiment persists in the coming days and OI continues to decline, it would be an uphill battle to sustain recovery above $40.00.
Technical outlook: HYPE holds key support
Hyperliquid is trading above the 200-day Exponential Moving Average (EMA) at $37.06, as bulls wrestle to resume recovery above the short-term resistance at $40.00.
The SuperTrend indicator, which uses the True Average Range (ATR) to gauge market volatility, has flipped to trail HYPE’s price, validating a buy signal on the daily chart.
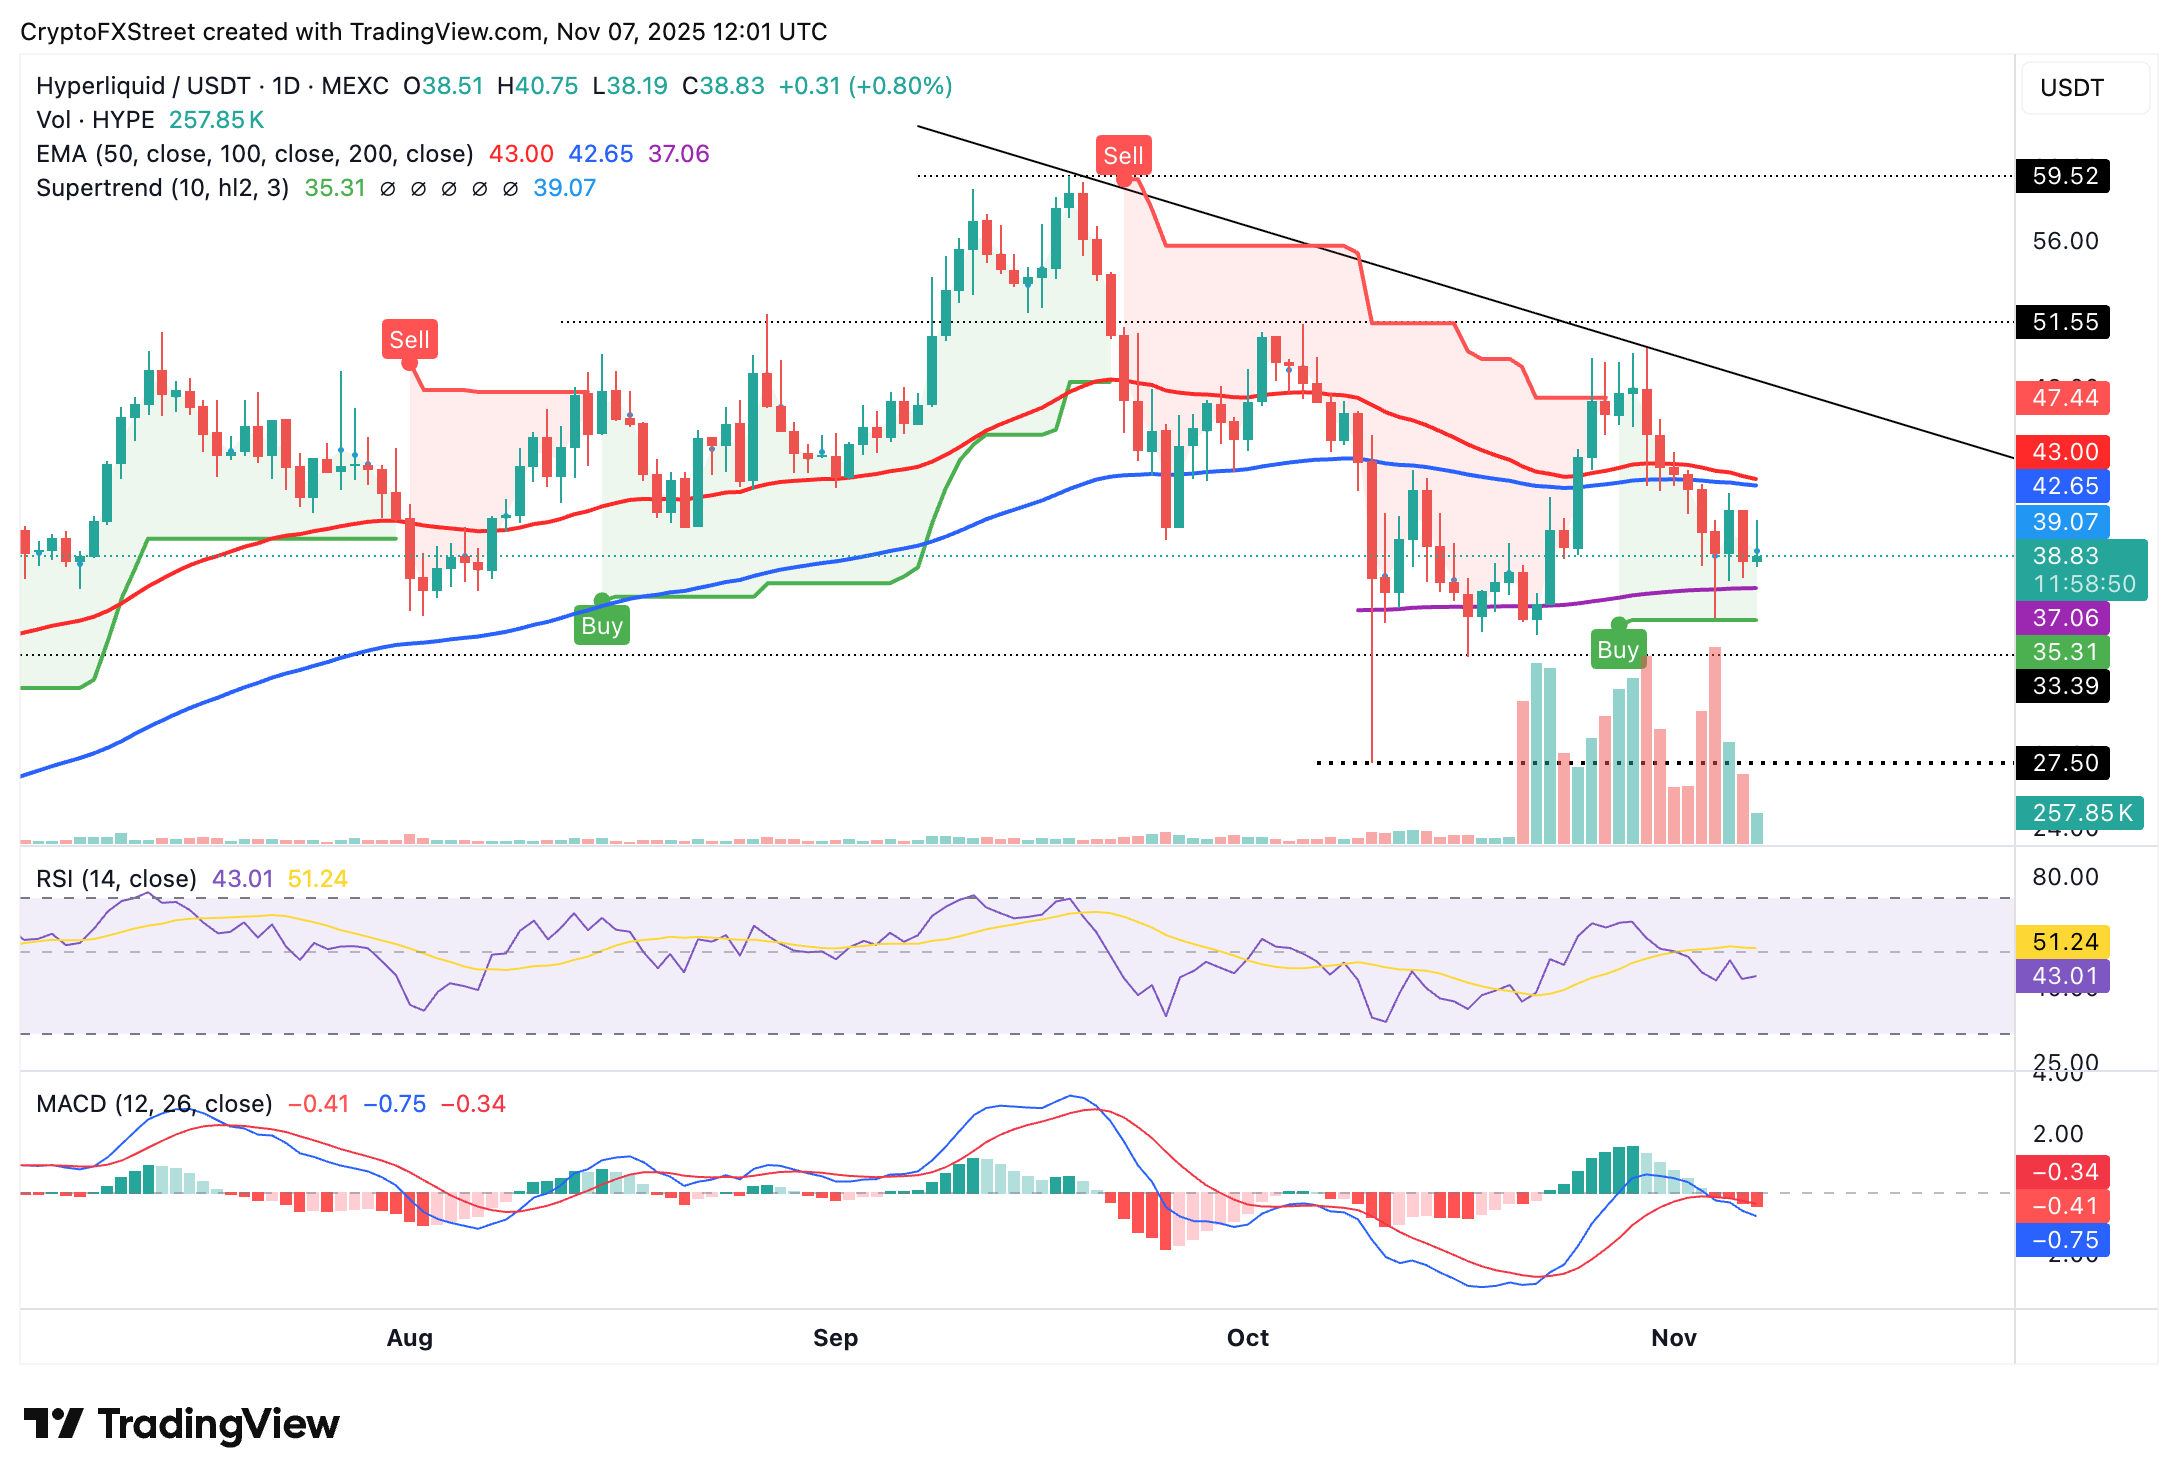
A daily close above $40.00 is required to steady the recovery. However, the Moving Average Convergence Divergence (MACD) on the daily chart has maintained a sell signal since Tuesday, predisposing HYPE to overhead pressure as investors reduce exposure.
Despite the Relative Strength Index (RSI) stabilising at 43 on the same daily chart, it has steadily declined from highs above 60 in late October, emphasising the increasing bearish pressure.
If HYPE drops below the 200-day EMA support at $37.06, the down leg could stretch to $33.40, a level last tested on October 17 and the October low of $27.50, in search of liquidity before attempting another rebound.
Open Interest, funding rate FAQs
Higher Open Interest is associated with higher liquidity and new capital inflow to the market. This is considered the equivalent of increase in efficiency and the ongoing trend continues. When Open Interest decreases, it is considered a sign of liquidation in the market, investors are leaving and the overall demand for an asset is on a decline, fueling a bearish sentiment among investors.
Funding fees bridge the difference between spot prices and prices of futures contracts of an asset by increasing liquidation risks faced by traders. A consistently high and positive funding rate implies there is a bullish sentiment among market participants and there is an expectation of a price hike. A consistently negative funding rate for an asset implies a bearish sentiment, indicating that traders expect the cryptocurrency’s price to fall and a bearish trend reversal is likely to occur.
Author

John Isige
FXStreet
John Isige is a seasoned cryptocurrency journalist and markets analyst committed to delivering high-quality, actionable insights tailored to traders, investors, and crypto enthusiasts. He enjoys deep dives into emerging Web3 tren


