How traders can prepare for an 80% crash in XRP price
- XRP price is approaching a stable inclined support trend line that could potentially pause the downtrend.
- Things could worsen for the remittance token despite the recent attempt at recovery.
- A daily candlestick close above $0.623 will invalidate the bearish thesis.

XRP price is showing strength as it bounces off a stable support level in line with an uptick in bullish momentum and recovery in Bitcoin price. Investors need to tread carefully, however, as the crypto markets are on the precipice of a capitulation move.
XRP price dips: to buy or to not
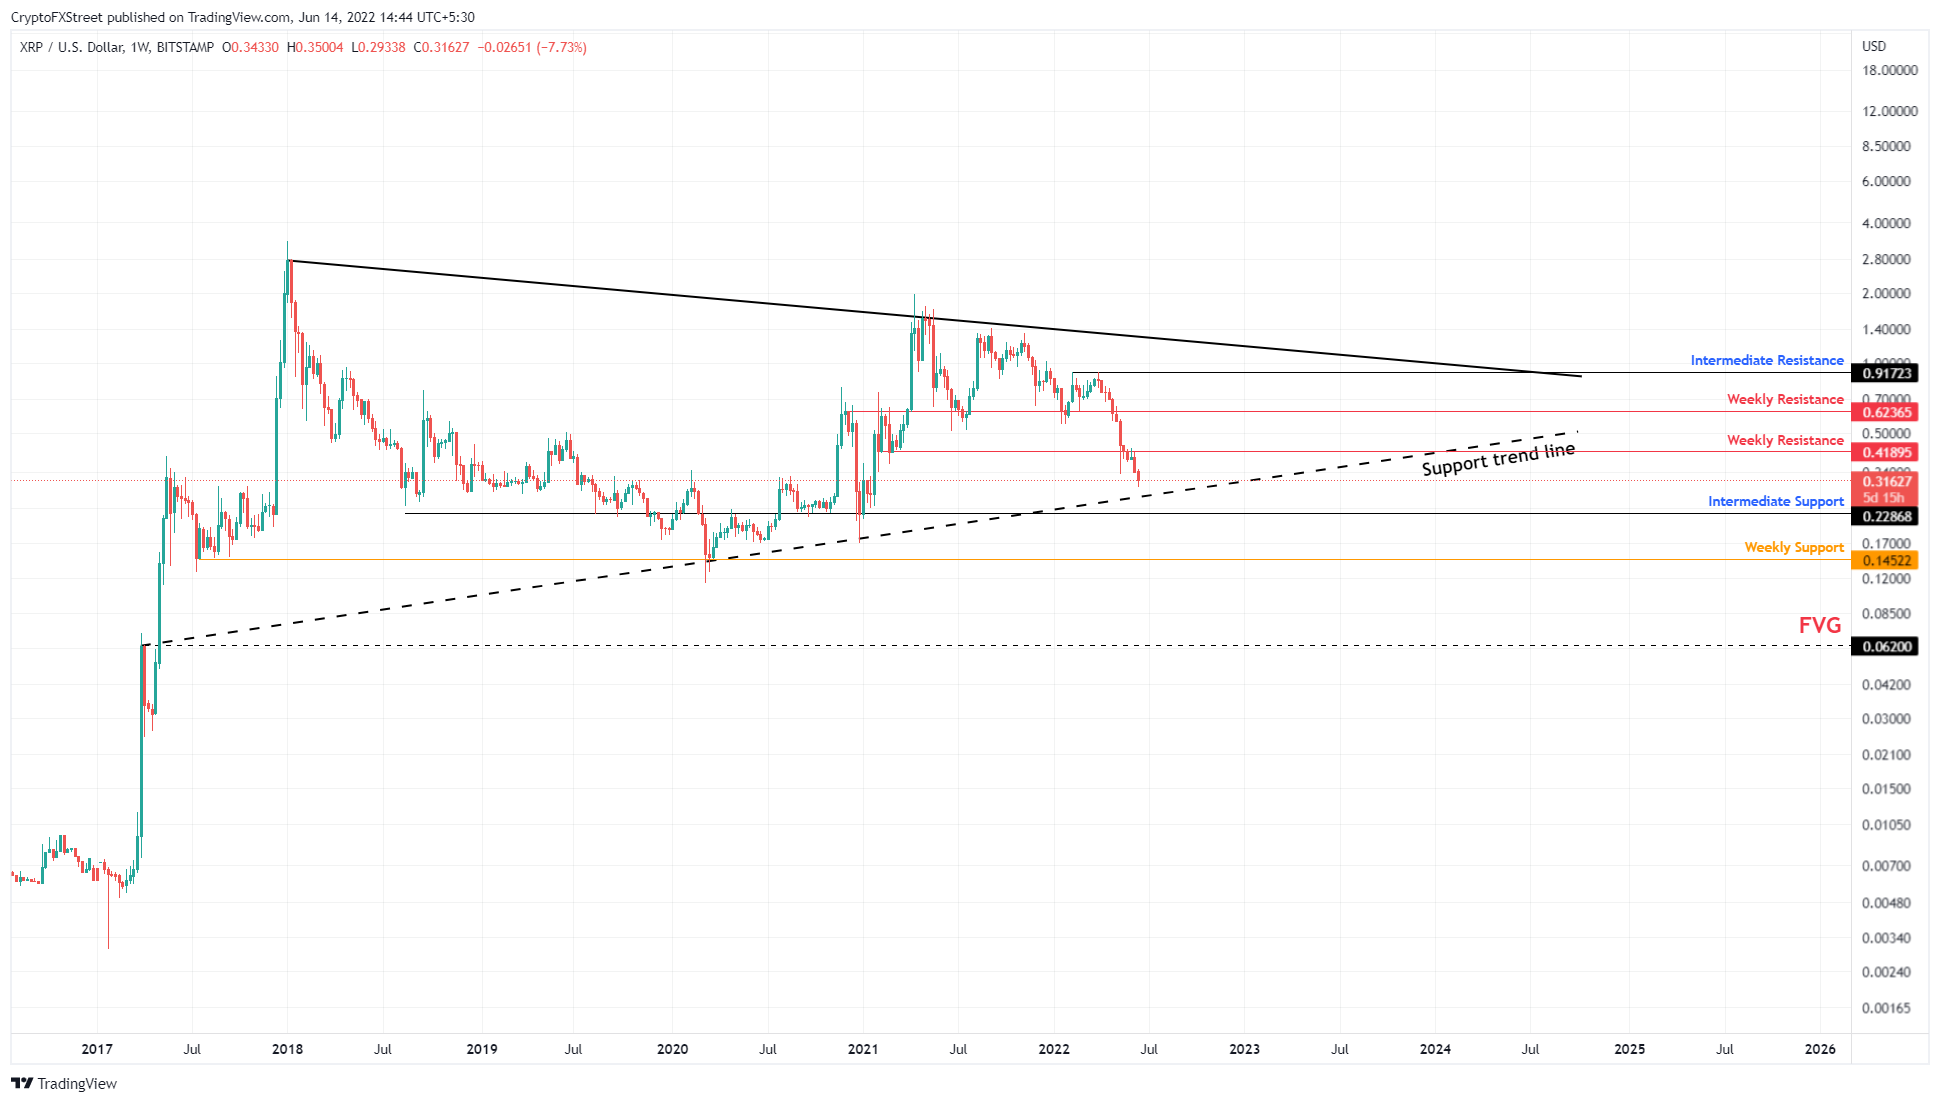
XRP price shows two distinctive lower highs on a weekly chart formed in January 2018 and April 2021. Interestingly, an inclined trend line can be drawn connecting the swing points formed in March 2017, March 2020 and December 2020.
While the overall price action might seem like a pennant, it does not meet the two+three criteria for the said setup. For a pennant, there need to be at least two swing highs and three swing lows connecting the trend lines or vice versa.
Although the bear market might seem to have bottomed there is a large amount of risk interwoven into the market and its participants. The fall of the Celsius Network could trigger a domino effect, causing a capitulation move.
For XRP price, if the inclined trend line and the intermediate support level at $0.228 are breached, it will signal a bearish move and trigger a 37% crash to the $0.145 weekly support level.
If this level is breached, all hell will break loose for Ripple as this move would catalyze a crash to $0.062 due to the price inefficiency formed during the 2017 bull run. This nosedive, however, would represent an 80% loss.
Hence, investors need to be careful with buying the dips due to FOMO.
XRP/USDT 1-day chart
The 30-day MVRV Ratio intraday metric is used to track the average profit/loss of investors that purchased XRP over the last month. The current MVRV value is hovering around -24%, suggesting that most of these holders are underwater.
Interestingly, there are five separate instances where the index has tagged this level - September 2021, December 2021, January 2022, May 2022 and June 13. The last three times the 30-day MVRV ratio intraday tagged these levels, XRP price rallied on an average of 27%.
Only the May 12 crash continued to favor the bears even after the on-chain metric hit -24%. Considering that the current situation is, in some ways, similar to the LUNA-UST situation, things could unfold favoring the bears.
 [13.49.26, 14 Jun, 2022]-637907948581214695.png)
XRP MVRV ratio intraday 30-day
On the other hand, if XRP price continues to recover things could change beyond a certain level. If Ripple bulls push XRP to produce a daily candlestick close above the $0.623 resistance barrier, it will flip it into a support floor. This development will invalidate the bearish thesis and will also allow sidelined buyers to step in.
In such a case, Ripple will need to create a higher low to continue the bullish trend and reach the upper trend line at roughly $0.917.
Author

Akash Girimath
FXStreet
Akash Girimath is a Mechanical Engineer interested in the chaos of the financial markets. Trying to make sense of this convoluted yet fascinating space, he switched his engineering job to become a crypto reporter and analyst.



