How to short the FOMC-driven Cardano price rally?
- Cardano price has created a bearish divergence, hinting at a potential retracement.
- Investors can expect ADA to see a 15% downswing under certain conditions.
- A daily candlestick close above $0.550 will invalidate this bearish outlook.

Cardano price is ready to take a U-turn after July 27’s rally as indicators display a clear trend reversal. Investors need to wait for a confirmation before triggering their short positions for ADA.
Cardano price bearish reversal is on the cards
Cardano price rallied 15% over the last 24 hours and set a lower high at $0.519. This move was prompted by the Federal Reserve’s interest rate hike of 75 bps. The announcement was followed by a spike in buying pressure for Bitcoin price and massive rallies for altcoins, including ADA.
However, for Cardano price, this bullish move comes as a forewarning of a bearish signal. The swing highs formed on July 23 and July 28 are lower highs, while the Relative Strength Index (RSI) has formed a higher high.
This divergence is a bearish one and forecasts a reversal in ADA’s recent rally.
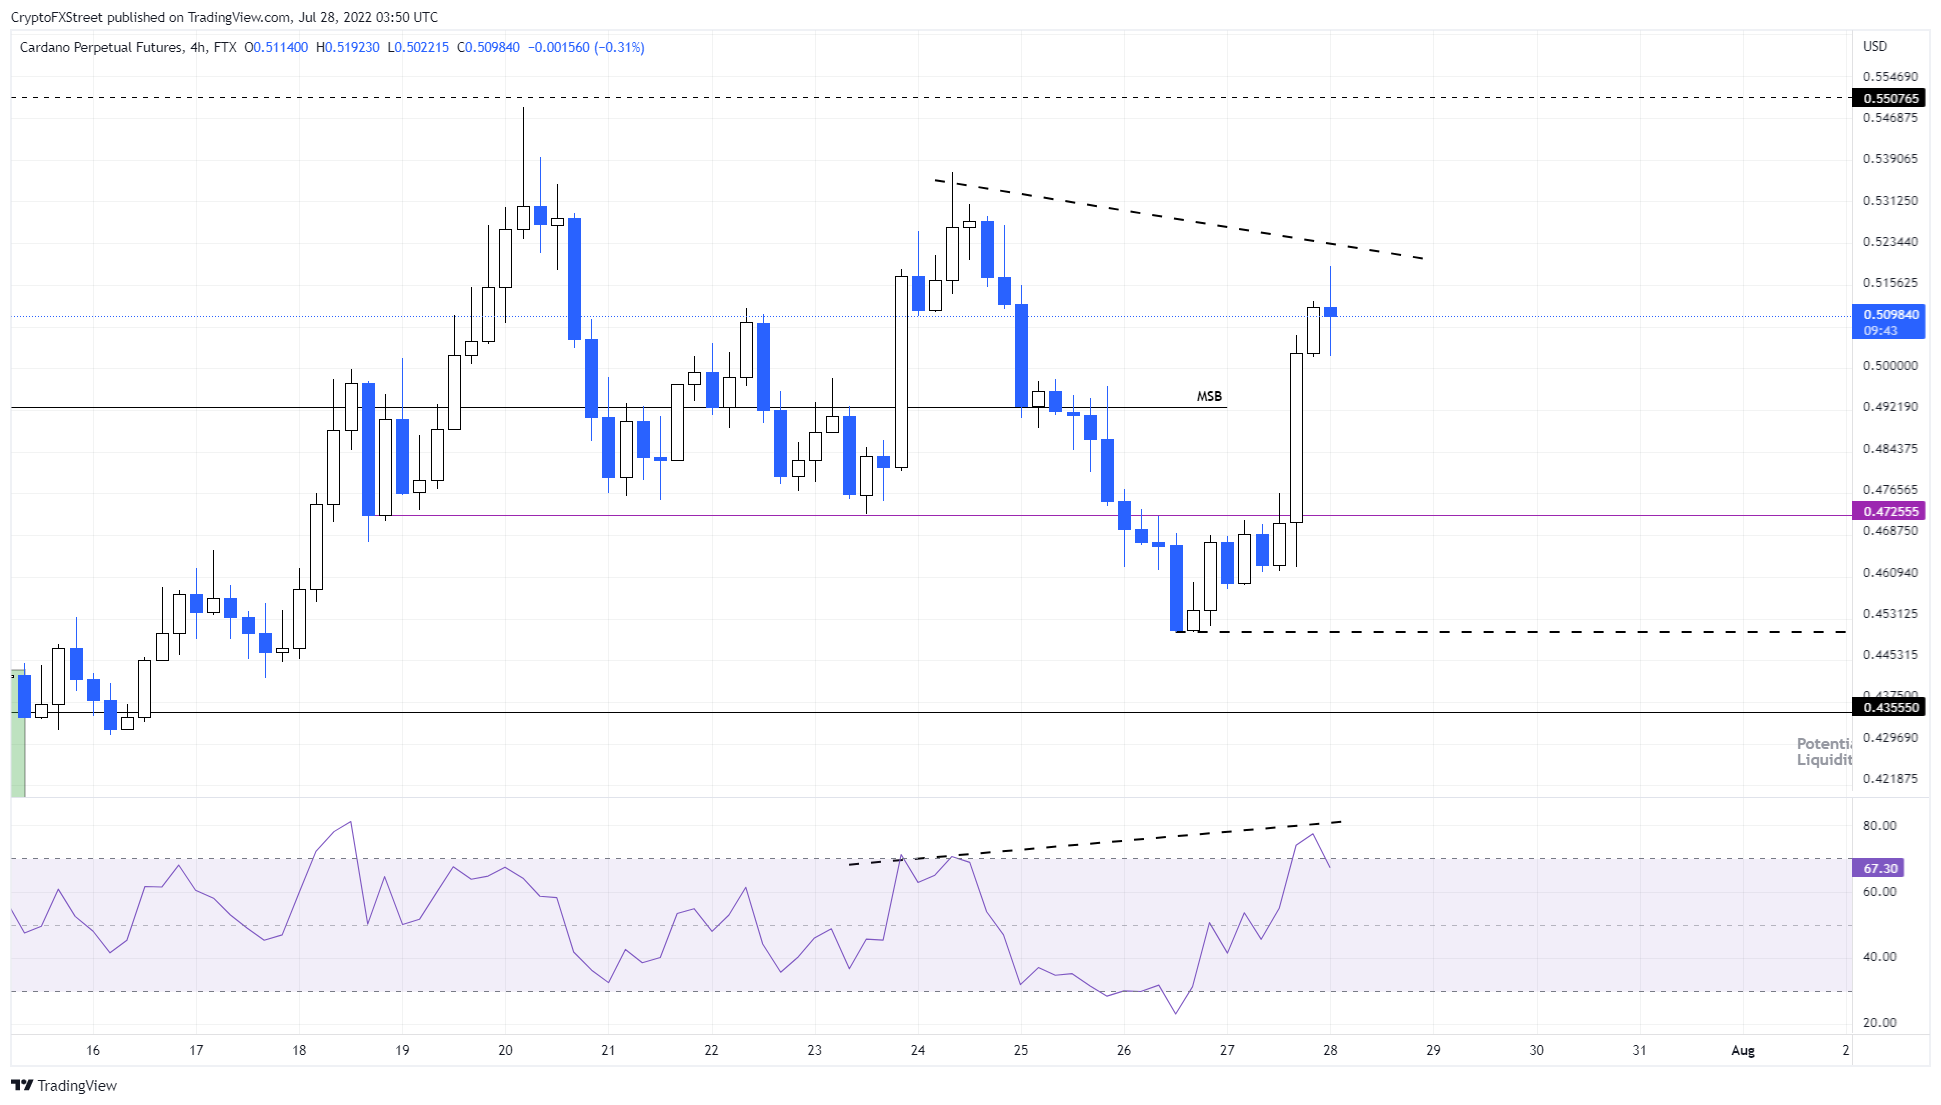
ADA/USDT 4-hour chart
ADA and market makers’ hidden agenda
While the technicals are clearly indicating a reversal of the recent rally for Cardano price, the fractal formation adds credence to this theory.
ADA formed a swing low at $0.435 on June 13 and the low was swept on June 18, triggering a 25% rally. During this liquidity run, the RSI dug below the oversold zone.
Similar events occurred for the June 30 swing low at $0.435, which was swept of any liquidity on July 13. This liquidity run on July 13 also caused the RSI to dip into the oversold zone.
Now, that ADA looks ready to retrace, investors can expect Cardano price not just to retest the $0.472 support level but shatter it and revisit the $0.435 level again. This move would sweep the July 26 swing low at $0.450 and potentially push the RSI into oversold territory.
So investors can play this move in two ways
- Short the move to $0.435
- Wait for the fractal to form and long ADA after a sweep of the $0.450 level or at the retest of $0.435.
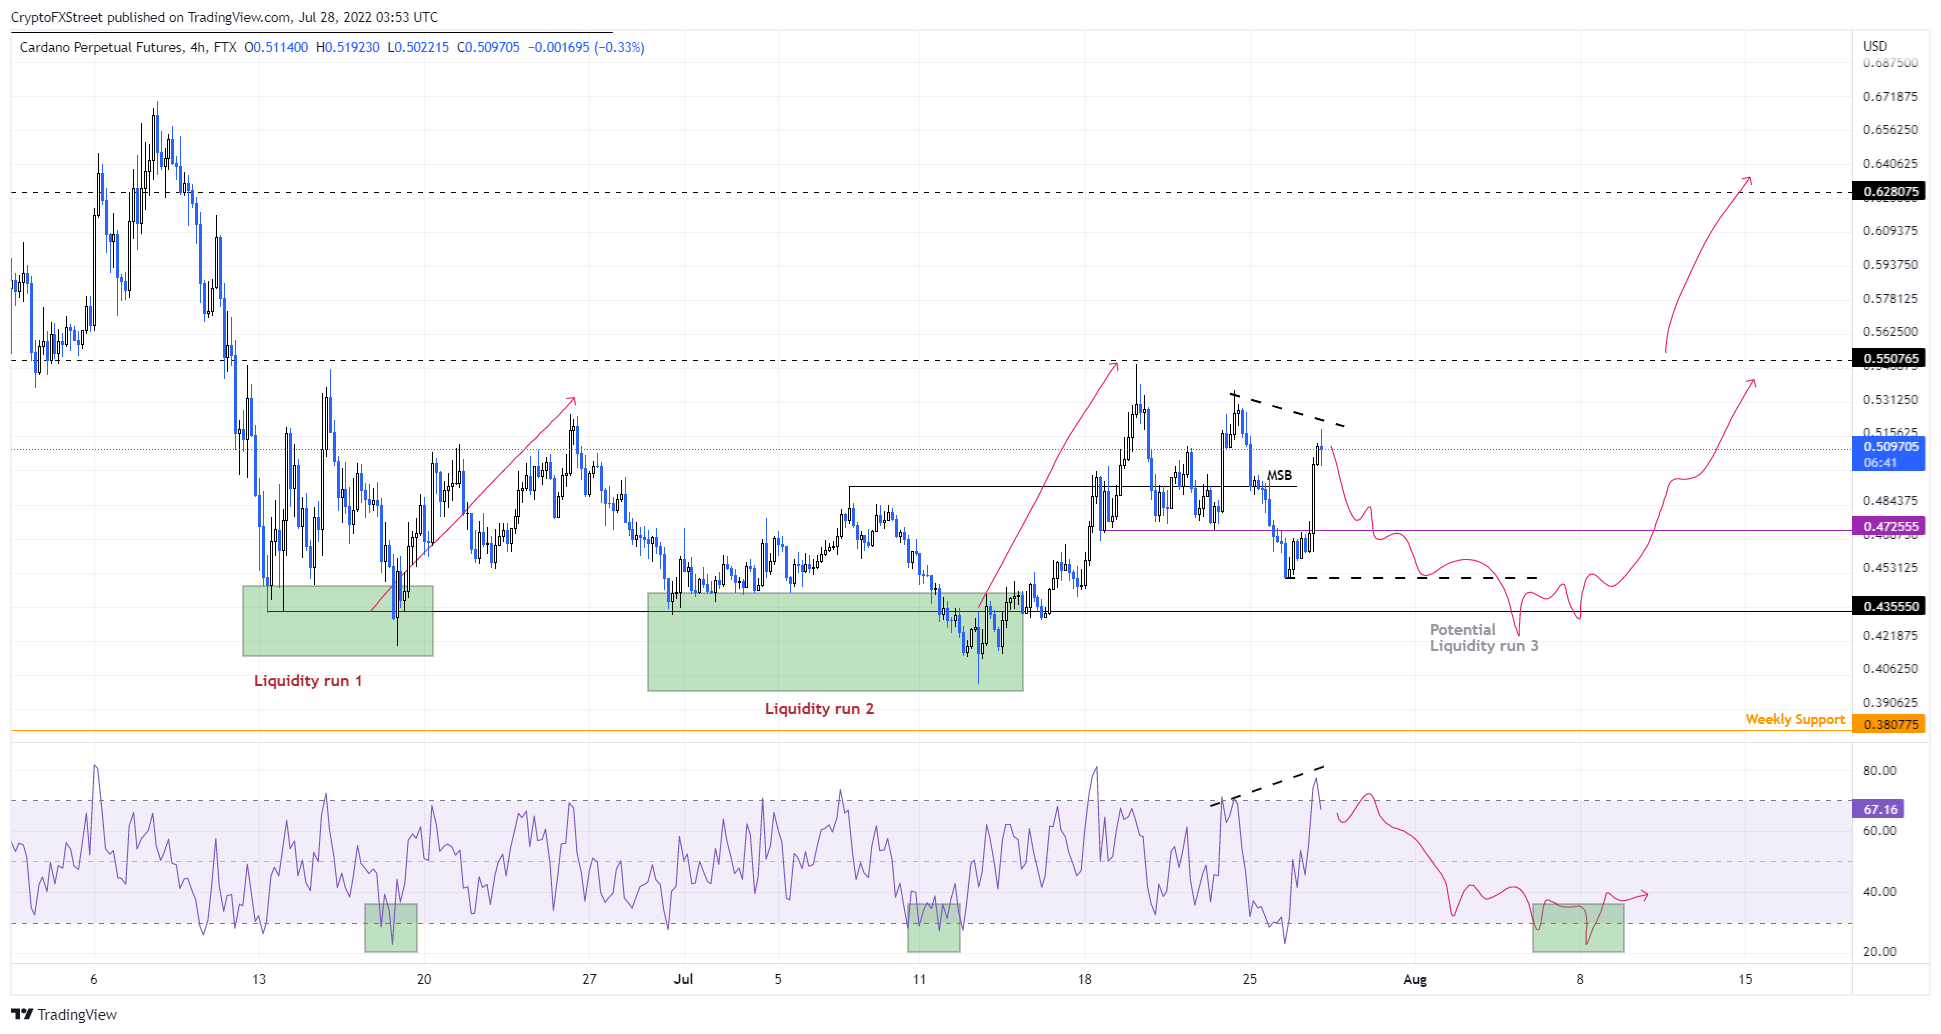
ADA/USDT 4-hour chart
On the other hand, if this bullish momentum continues to propel Cardano price higher, there is a chance that the short opportunity described above might not arrive. If ADA produces a daily candlestick close above $0.550, it will invalidate the bearish outlook.
In such a case, Cardano price might revisit the $0.628 hurdle.
Author

Akash Girimath
FXStreet
Akash Girimath is a Mechanical Engineer interested in the chaos of the financial markets. Trying to make sense of this convoluted yet fascinating space, he switched his engineering job to become a crypto reporter and analyst.


