HoloChain Technical Analysis: HOT/USD massive 52% rally in less than 24 hours hitting $0.0008
- HOT/USD is up by more than 50% in the last 24 hours after a massive breakout.
- HOT climbed above several resistance levels and it’s getting close to the 2020-high of $0.0009

Holochain has experienced one of its biggest pumps ever with a ton of trading volume of around $80 million. For the most part, HOT was mimicking the action of important coins like Bitcoin, however, on July 8, the digital asset had a significant 13% price surge followed by an even bigger bull move on July 9.
HOT/USD daily chart
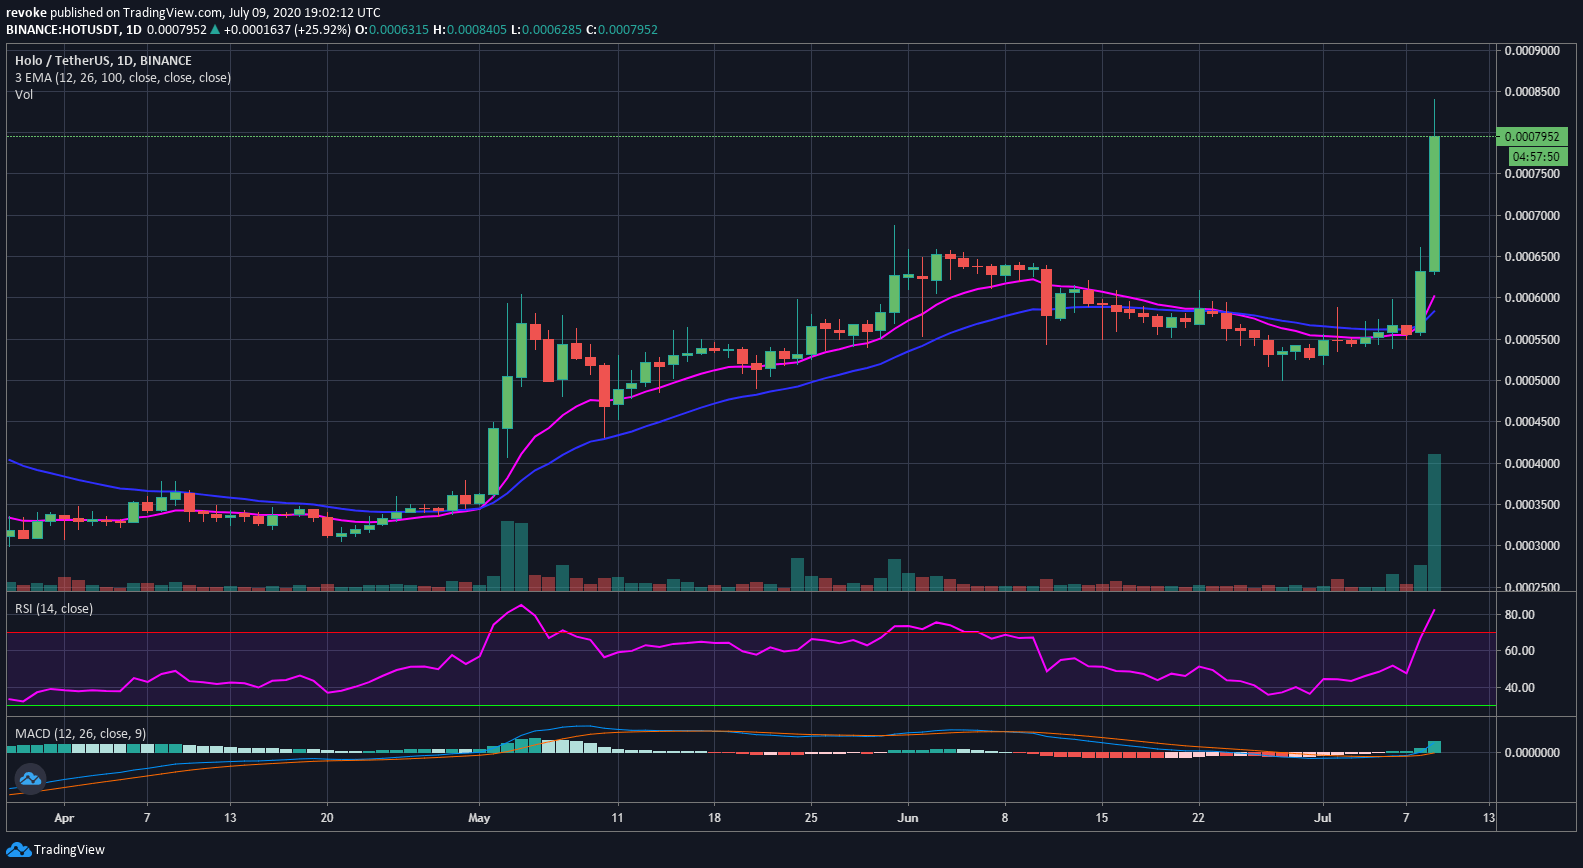
The daily chart is clearly in favor of the bulls now and there is basically no resistance until $0.00094, the 2020-high. The increase in trading volume is obvious and shows that the recent rally is not just a random pump.
HOT/USD 4-hour chart
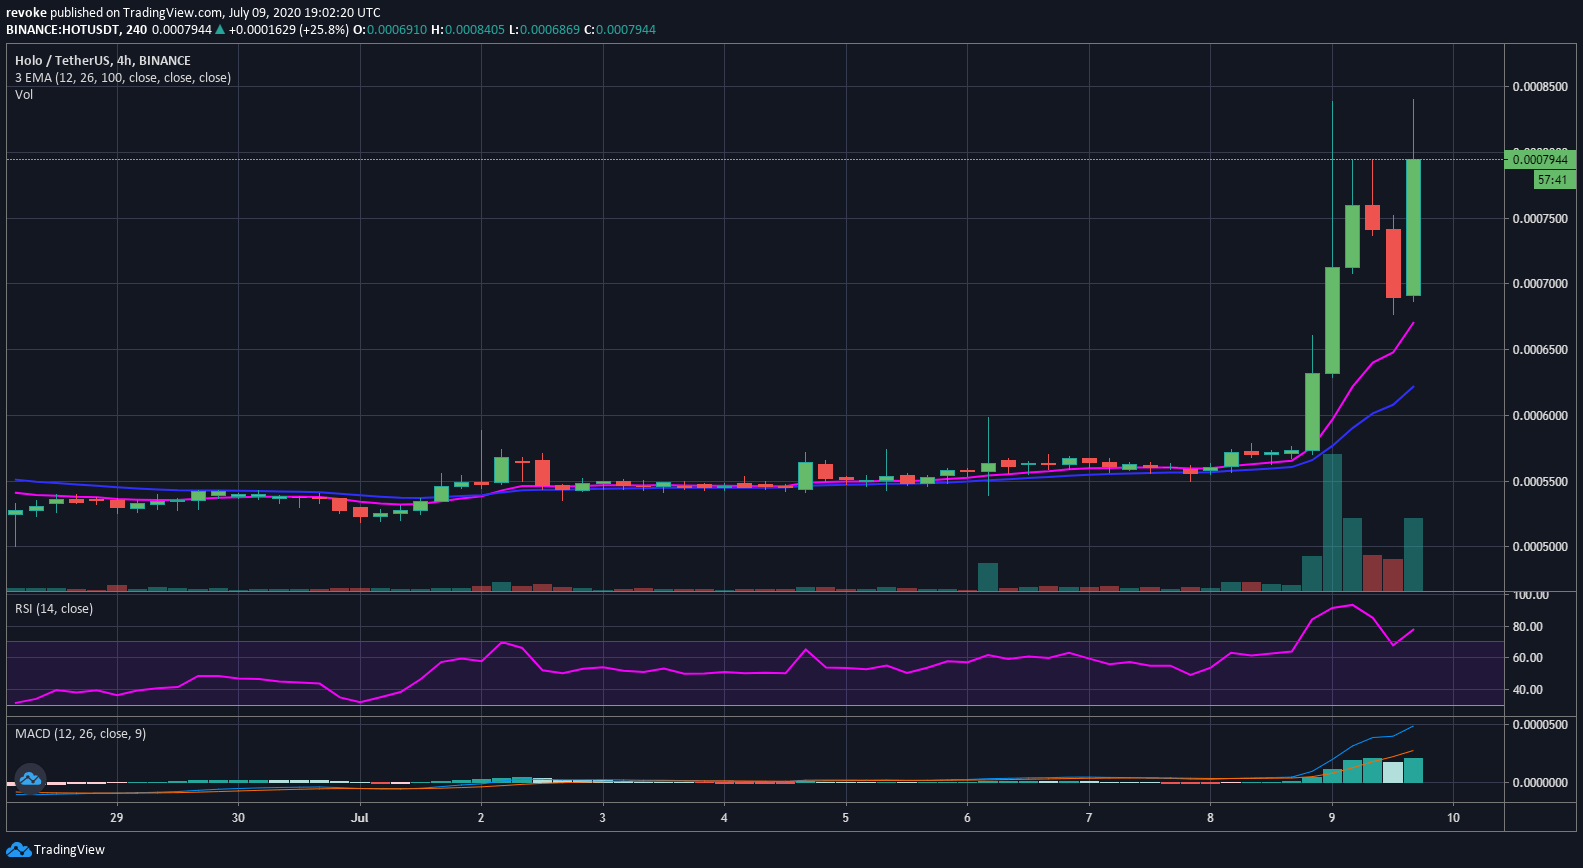
The 4-hour chart indicates that HOT is ready for another leg up after a brief consolidation and significant continuation. The RSI is overextended but won’t stop the bulls considering how strong the momentum is. The MACD is extremely positive and both EMA’s are bullish.
Author

Lorenzo Stroe
Independent Analyst
Lorenzo is an experienced Technical Analyst and Content Writer who has been working in the cryptocurrency industry since 2012. He also has a passion for trading.


