Historically accurate Bitcoin metric suggests BTC price has bottomed out

As the price of Bitcoin (BTC) is attempting to establish support at $37,000 on Tuesday, the recent $30,000 lows may have been the bottom, suggests one derivatives market indicator that has a history of accurately predicting BTC/USD cyclical lows following its bear cycles.
The last time it predicted a bottom was on Nov. 1, following which the cost to purchase one Bitcoin surged from $13,771 to as high as $64,899 on Coinbase.
Anatomy of a bullish indicator
Dubbed as “rolling basis,” the indicator mathematically represents the relative difference between the price of the futures contract and the spot rate on an annual timeframe. For instance, if a Bitcoin contract trades at a 2.5% premium for its spot price on the three-month basis chart, then its annualized rolling basis comes to be 10%.
In hindsight, assets in the futures market trade either at a discount or a premium. When an asset’s spot rate is higher than its futures price, this is is called backwardation (discount). Conversely, when the spot rate trades below the futures one — which is typical in traditional financial markets — it ̦represents the state of contango (premium).
Bitcoin futures markets tend to fluctuate between backwardation and contango. An extreme contango often signals a top in a bull market. Conversely, an extreme backwardation helps to find potential bottoms in a bear market.
For instance, in June 2019, the Bitcoin Futures market on OKEx experienced a contango rise above the 3.5% level. It peaked around at 6.8% in the same period Bitcoin crossed $11,000. However, the BTC/USD spot rate kept on rising until it reached $14,000. Thereafter, the pair entered a multi-month bear market, bottoming out near $3,100 eventually in December 2019.
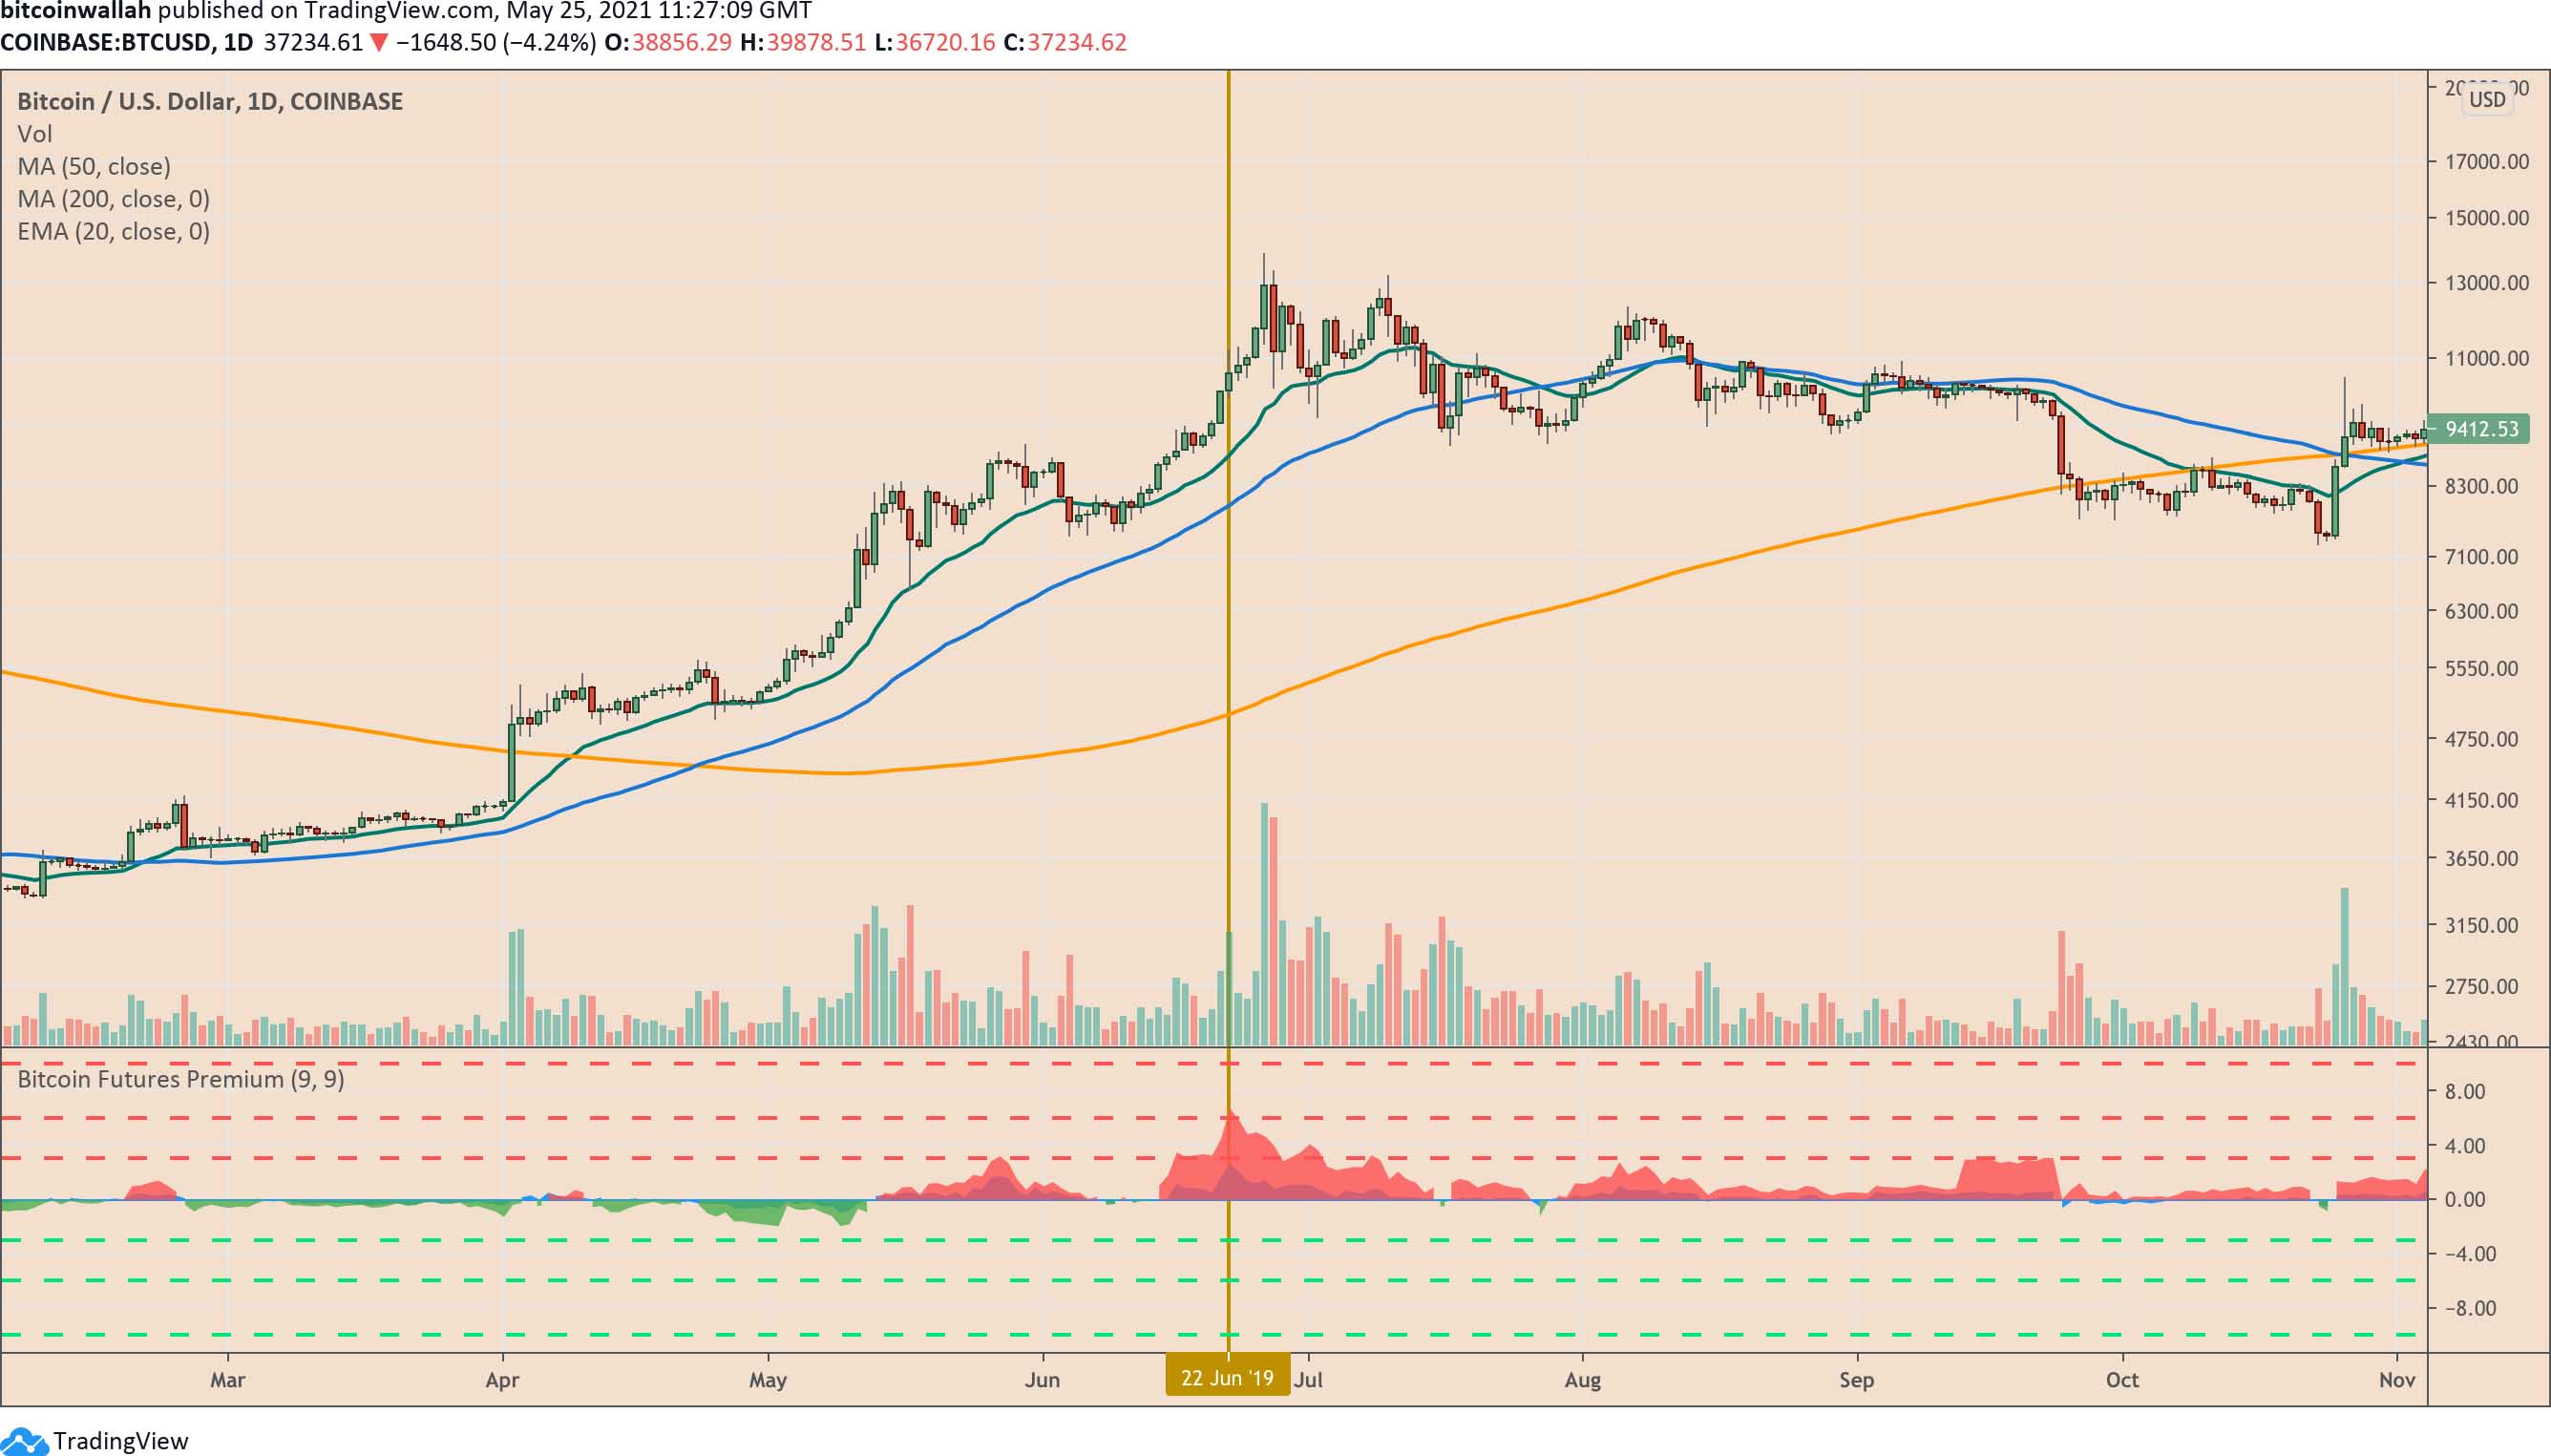
Bitcoin Futures contango example from June 2019. Source: TradingView
Ben Lilly, a crypto economist at Jarvis Labs, pitted the reading on the “BTC Futures Annualized Rolling 3 Month Basis” chart against the Bitcoin spot prices, noting that when the former approaches or closes below 1%, the latter takes it as a cue to bottom out and start a new upside cycle.
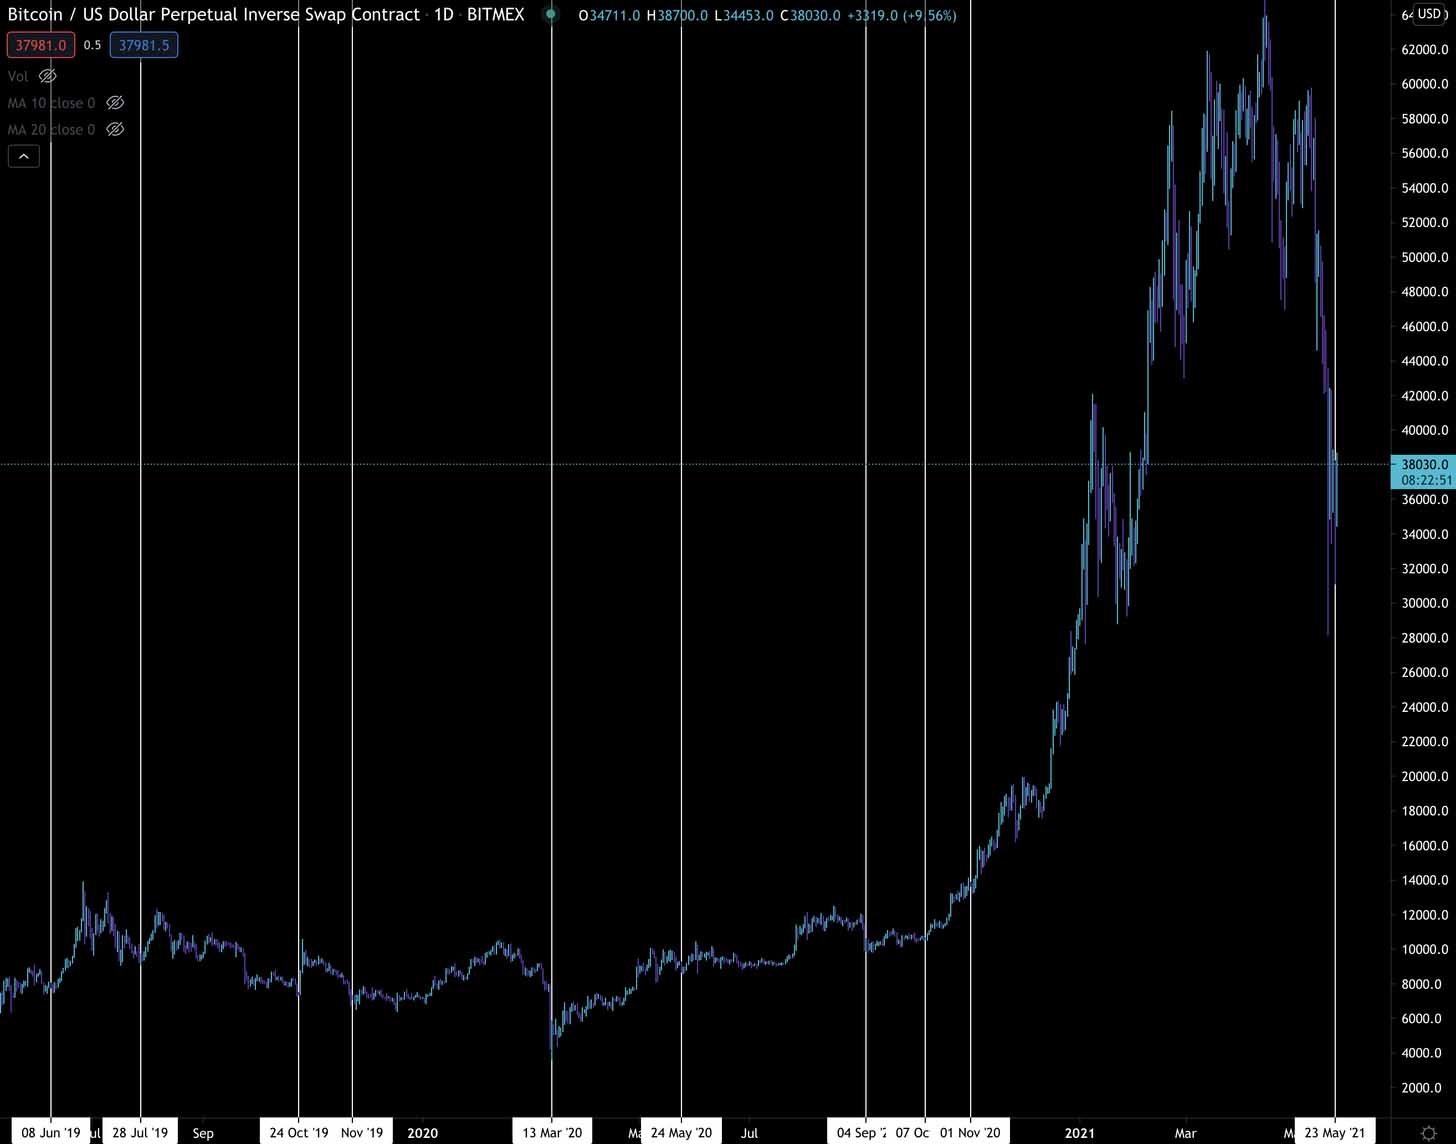
The vertical lines show the day when Bitcoin rollin basis reached 0%. Source: BitMEX
The BitMEX chart above shows several instances wherein the rolling basis reading fell below 1% during Bitcoin’s downside moves in the spot market. The cryptocurrency later started experiencing a rebound rally — a new bullish cycle — before correcting all over again to find a new bottom just as the rolling basis slipped below 1%. Rinse and repeat.
For instance, in March 2020, during the coronavirus-led global market crash, Bitcoin futures logged a backwardation rise to just shy of negated 14%, which would mark Bitcoin’s bottom in the spot market at around $3,858.
Bitcoin futures rolling basis as of May 25
Lilly shared a Skew chart that showed BTC Futures annualized rolling basis slipping below 1% for the first time since November 2020.
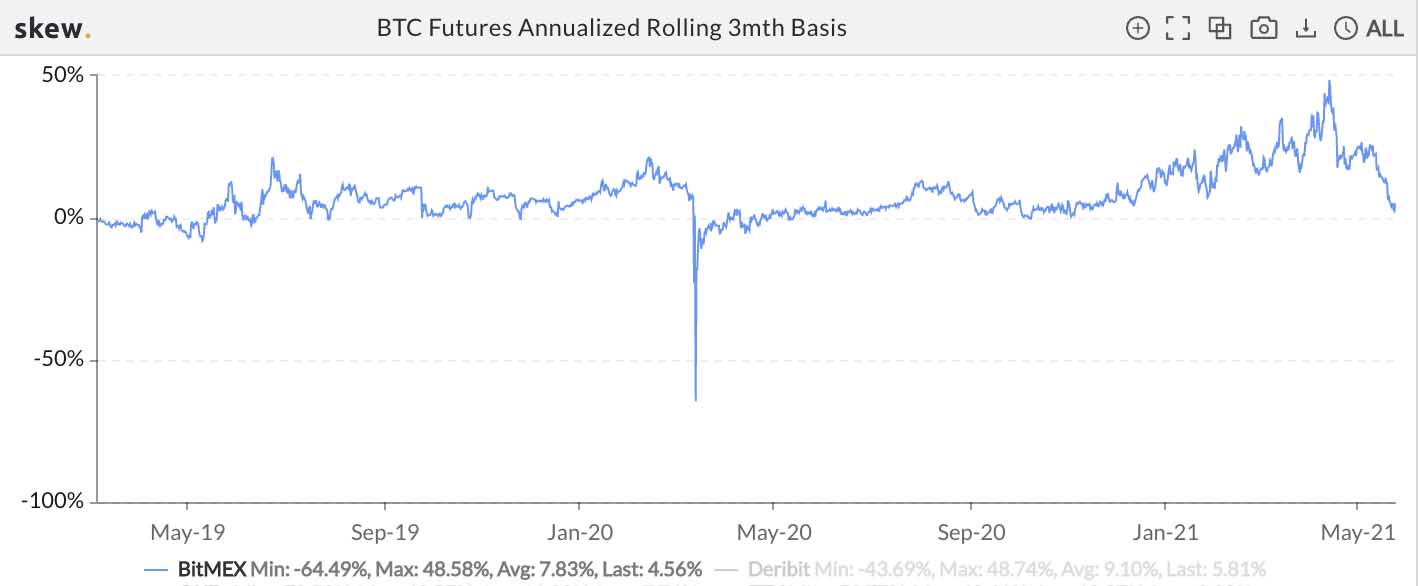
Bitcoin rolling basis dropped below 1% following May’s crash in spot markets. Source: Skew
“This looks promising in terms of finding a bottom,” noted Lilly in his newsletter.
“It harkens back to why we use funding rates so much. Because just when people think crypto is coming to an end and it’s off to the woodshed, it bounces back.”
He added that based on basis readings alone, it is a good time for Bitcoin spot traders to accumulate, albeit noting that it does not mean opening leveraged long positions in the futures market.
The risks appeared higher in the derivatives market due to lack of bullish transactions. Lilly said the sell-off pressure has not subsided even after 6 billion worth of USD Coin (USDC) entered the market — a sign that traders want to use the dollar-pegged stablecoin to buy cryptocurrencies like Bitcoin.
“Right now we’re flying in no man’s land,” he added.
The statements appeared as Bitcoin showed an extreme bias conflict short term, logging wild intraday price swings in the previous sessions. The Monday session saw BTC’s price get rejected by resistance at the $40,000 level.
Currently, BTC is attempting to find support at $37,000, roughly 40% below the all-time high.
Author

Cointelegraph Team
Cointelegraph
We are privileged enough to work with the best and brightest in Bitcoin.


