Ripple price breaches 700-day trend line, signaling a gloomy picture for XRP holders
- Ripple price slipped below a crucial 700-day uptrend support level on the weekly chart.
- Subsequent attempts at recovery have failed, leading to an ongoing consolidation.
- A breakdown of the current support level of $0.468 will lead to a bloodbath for XRP holders.
Ripple (XRP) price has been in a precarious position for nearly three weeks, leaving XRP holders wondering what could come next.
Also read: XRP hovers above $0.50 as Ripple joins alliance to simplify recovery of digital assets
Ripple price needs to make a decision
Ripple price has breached an inclining trend line connecting swing lows formed since June 2022. This key support trend line was breached on April 8 crash, which led to the production of a weekly candlestick close below the inclining trend line and the weekly support level of $0.532.
Since then, Ripple price is consolidating between $0.532 and $0.468, with no directional bias in sight.
The Relative Strength Index (RSI), on the weekly time frame, has slipped below the mean level of 50, signaling a waning bullish momentum and a rise in seller momentum. The same can be noticed with Awesome Oscillator’s mean level of 0. Both the momentum indicators are forecasting a shift in the market outlook favoring bears.
Until the crypto market outlook improves, XRP price is in a bad spot. If Bitcoin (BTC) recovers and climbs above $70,000 altcoins will see a recovery rally. In such a case, Ripple price needs to overcome the $0.532 resistance level and flip into a support floor. This development will be key to attract sidelined buyers and propel the remittance token inside the inclining trend line. The next stop for XRP, in a highly bullish case, could be a retest of the $0.696 resistance level.
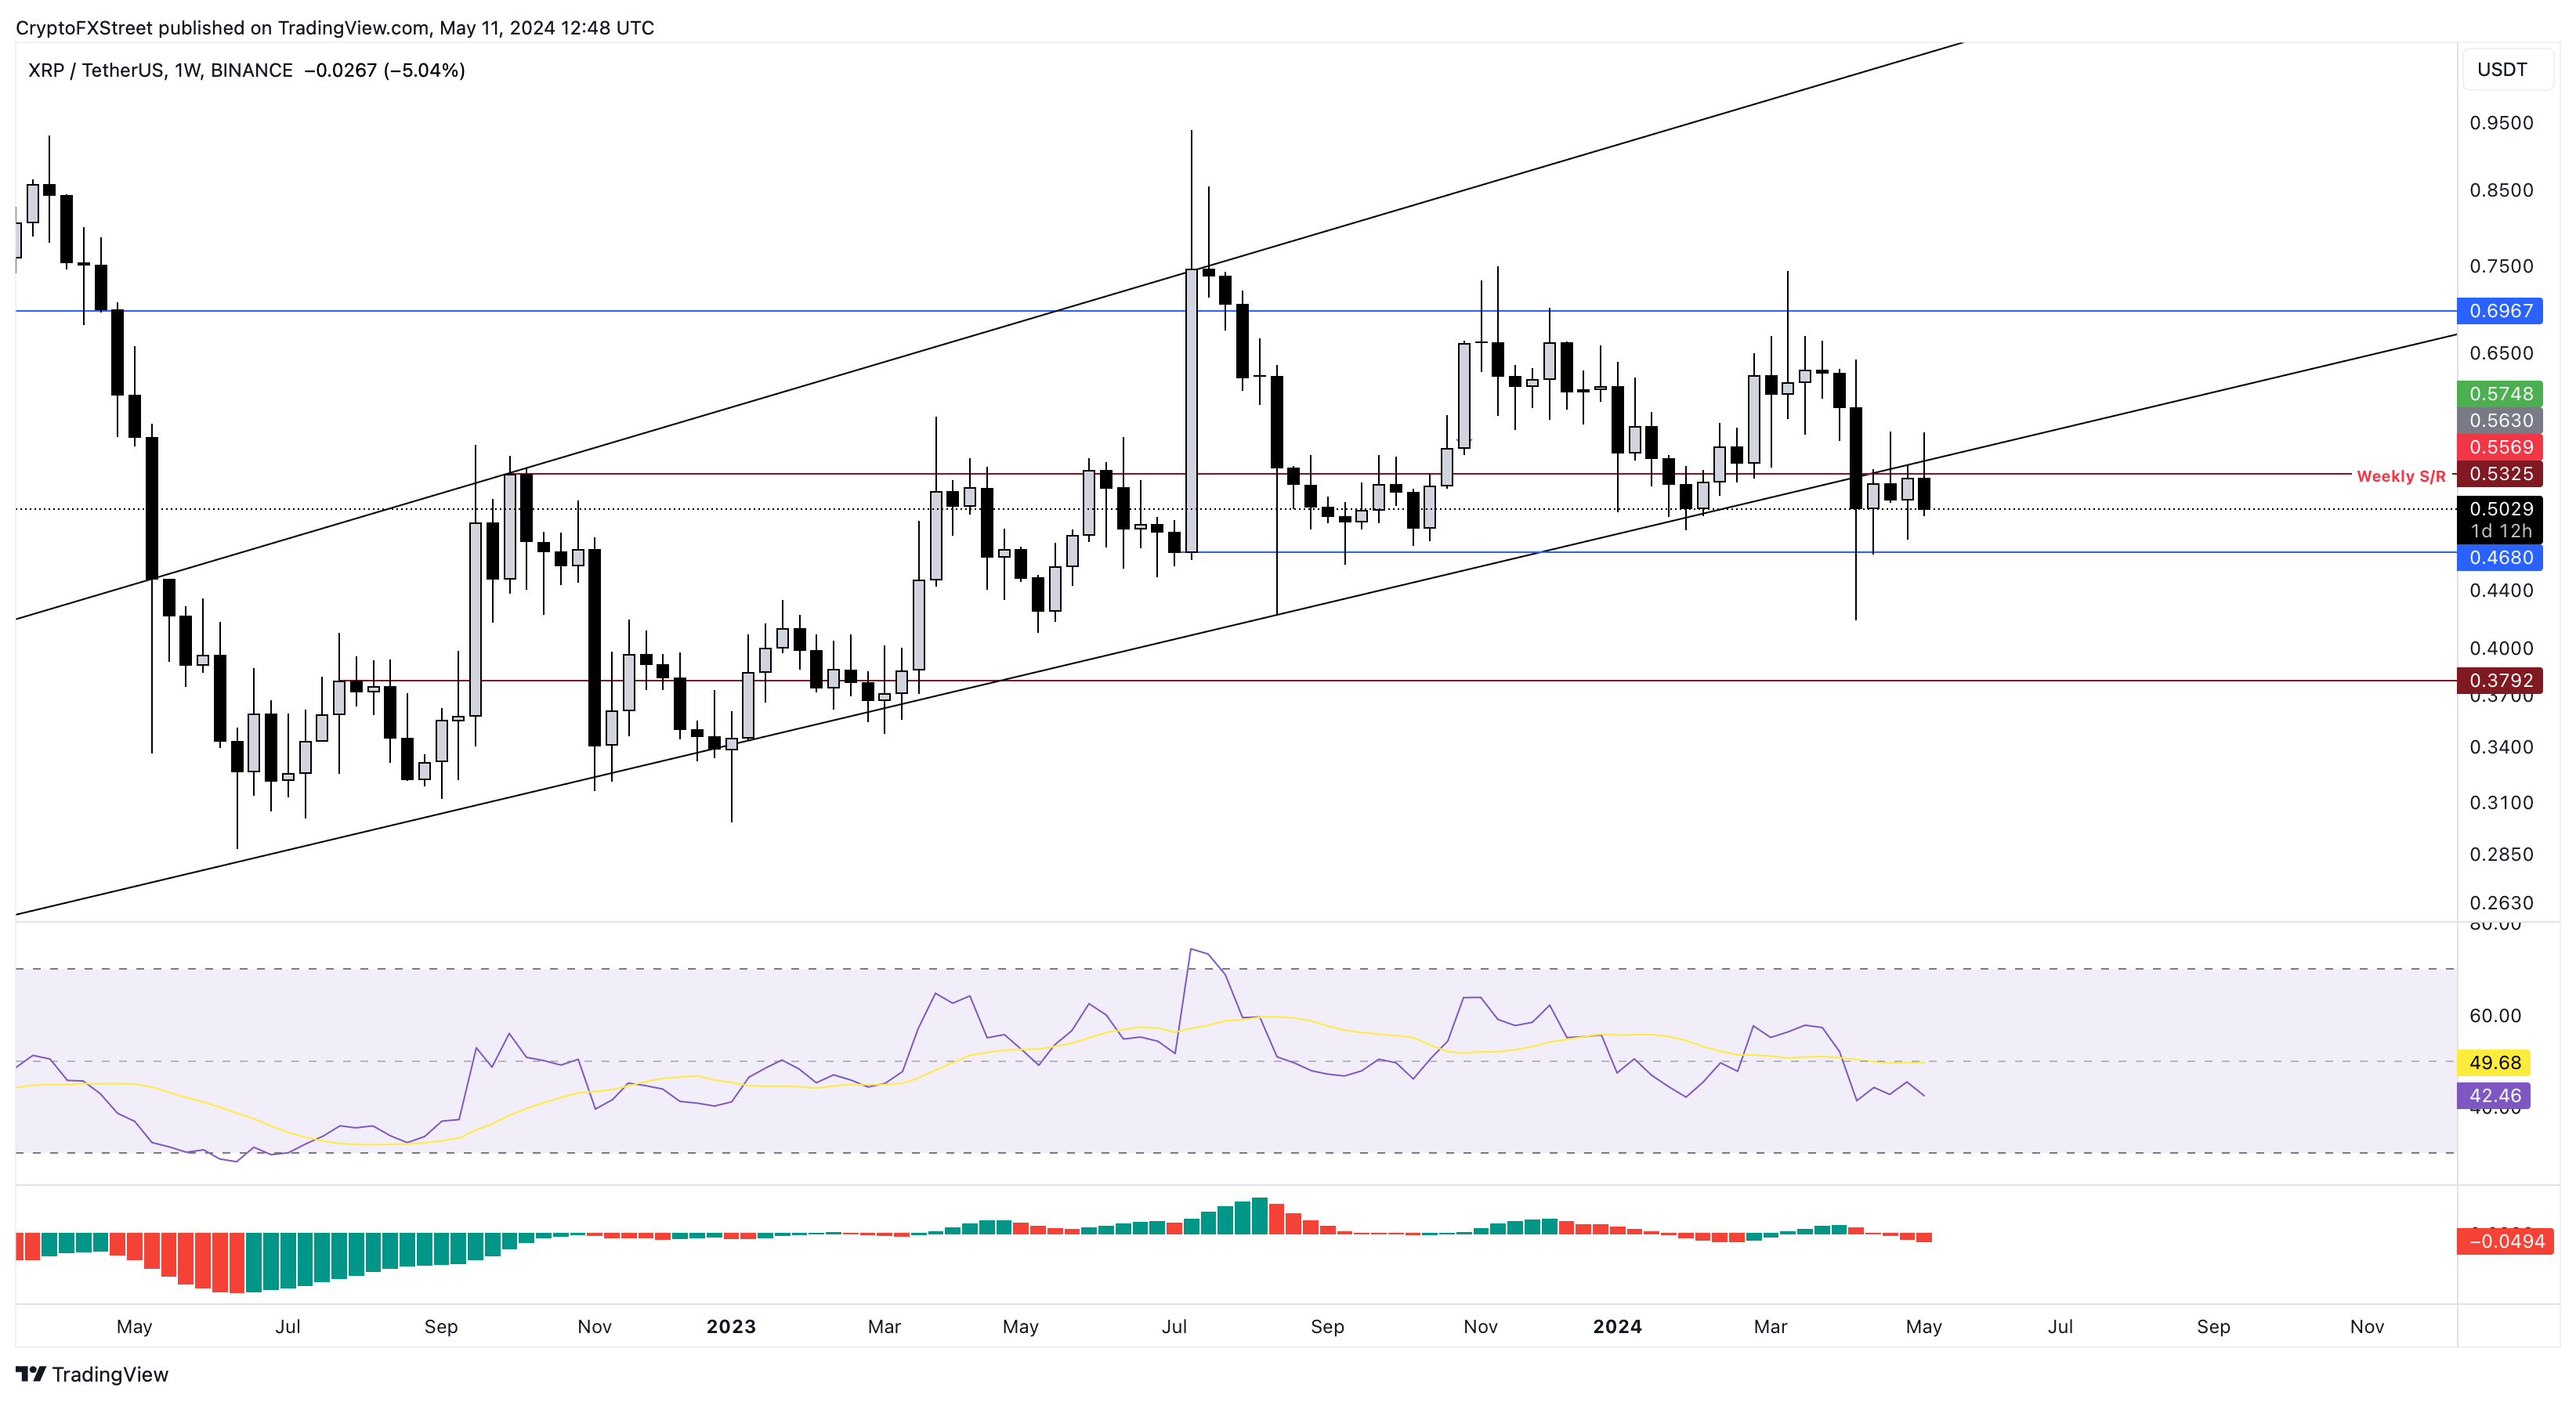
XRP/USDT 1-week chart
On the contrary, if the crypto market outlook worsens, Ripple price will likely retest and breakdown the $0.468 support level. This development would invalidate the bullish thesis and trigger a selling spree from XRP holders. Such an outlook could see the remittance token crash 11% and tag the $0.428 intermediate support floor. In a dire case, XRP could revisit the $0.378 foothold.
Author

Akash Girimath
FXStreet
Akash Girimath is a Mechanical Engineer interested in the chaos of the financial markets. Trying to make sense of this convoluted yet fascinating space, he switched his engineering job to become a crypto reporter and analyst.


