• After a 284% climb, Fetch.ai price has met formidable opposition at $0.7540, capping its upside potential.
  • FET could drop 10% if it loses the support due to the 25-day EMA amid falling momentum.
  • The deeper correction scenario will be invalidated upon a decisive candlestick close above $0.7540.

Fetch.ai (FET) price has been on a pronounced uptrend since around October 18, when the crypto market turned bullish. Its price action since then has been characterized by higher highs and higher lows. This was the case until the AI crypto coin met opposition, and now its upside potential appears limited.

Also Read: Fetch.AI price rally likely with retail investor accumulation of FET tokens

Fetch.ai price eyes 10% drop

Fetch.ai price appears poised for an extended fall, potentially going 10% deep as the support offered by the 25-day Exponential Moving Average (EMA) at $0.6729 breaks. It comes after a strong dip that saw FET record an intra-day low of $0.5654. Although the market buying the dip facilitated a strong bullish rejection, buyer momentum remains low, and the AI crypto coin now appears unable to flip the 25-day EMA back to a support.

Enhanced seller momentum could see Fetch.ai price extend lower, going as low as the 50-day EMA at $0.6010, or lower, to tag $0.5844, 10% below current levels. A break and close below this level on the daily timeframe would violate the prevailing bullish outlook.

In the dire case, the slump could extend for Fetch.ai price to test the 100-day EMA or worse, the 200-day EMA, with such a move constituting a 40% drop below current levels.

The Relative Strength Index (RSI) is nose-diving and could soon cross below the 50 level, not only showing that momentum is falling but also suggesting that the bears are gaining ground as the bulls loosen their grip.

The Average Directional Index (ADX) indicator is also showing signs of being subdued, deviating to the south with a 36 reading. This, coupled with the histogram bars of the Awesome Oscillator (AO) that continue reducing in volume towards the midline, accentuates the bearish thesis.

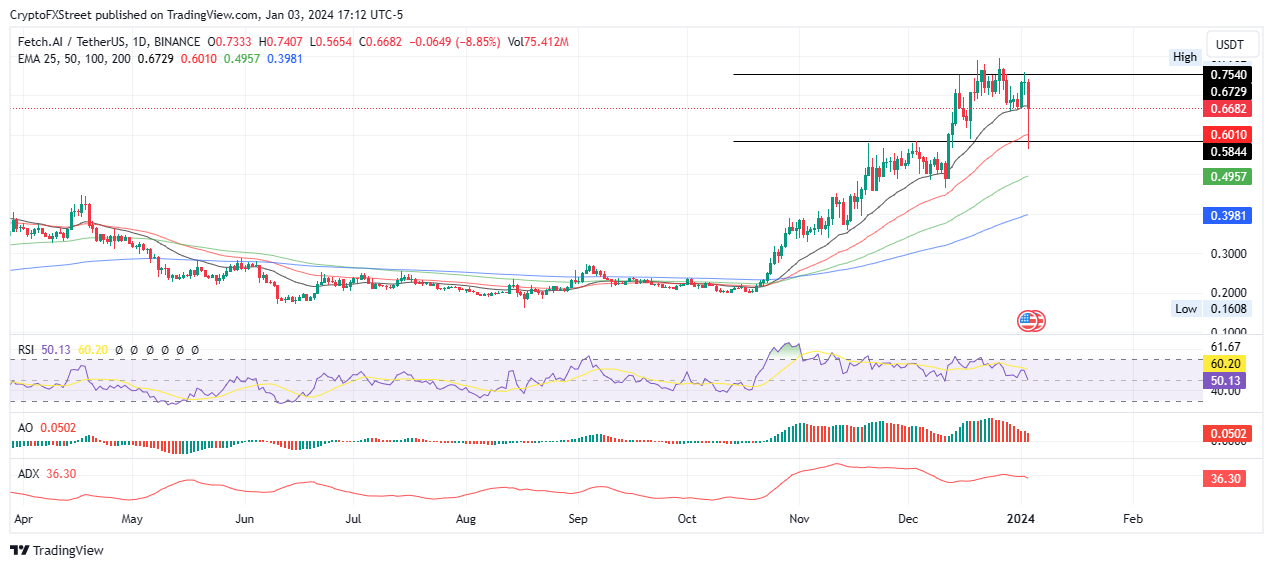
FET/USDT 1-day chart

On-chain metrics supporting Fetch.ai price bearish outlook

Data from Santiment shows a spike in active deposits, which points to more tokens flowing into centralized exchanges. This often precedes a rise in short-term sell pressure. Since mid-December, there has been an effective drop in withdrawal transactions, moving from 230 to the current 46, showing a reduced accumulation trend.

FET Santiment: Price, Active Deposits, Withdrawal Transactions

The development activity and network growth metrics also show signs of being subdued, adding credence to the bearish thesis. These metrics show that the project has not been making any significant traction in both user adoption and project upgrades.

FET Santiment: Price, Development activity, Network growth

On the other hand, if the bulls find strength, potentially as sidelined or late investors buy the dip, Fetch.ai price could recover north. While a restoration above the 25-day EMA would be ideal, the correction thesis will only be invalidated once FET price records a candle stick close above $0.7540 on the daily timeframe.

In a highly bullish case, the gains could extend higher for the Fetch.ai price to clear the range high at $0.7952, with the potential to tag the $0.8000 psychological level. Such a move would denote a 23% climb above current levels. 


Information on these pages contains forward-looking statements that involve risks and uncertainties. Markets and instruments profiled on this page are for informational purposes only and should not in any way come across as a recommendation to buy or sell in these assets. You should do your own thorough research before making any investment decisions. FXStreet does not in any way guarantee that this information is free from mistakes, errors, or material misstatements. It also does not guarantee that this information is of a timely nature. Investing in Open Markets involves a great deal of risk, including the loss of all or a portion of your investment, as well as emotional distress. All risks, losses and costs associated with investing, including total loss of principal, are your responsibility. The views and opinions expressed in this article are those of the authors and do not necessarily reflect the official policy or position of FXStreet nor its advertisers. The author will not be held responsible for information that is found at the end of links posted on this page.

If not otherwise explicitly mentioned in the body of the article, at the time of writing, the author has no position in any stock mentioned in this article and no business relationship with any company mentioned. The author has not received compensation for writing this article, other than from FXStreet.

FXStreet and the author do not provide personalized recommendations. The author makes no representations as to the accuracy, completeness, or suitability of this information. FXStreet and the author will not be liable for any errors, omissions or any losses, injuries or damages arising from this information and its display or use. Errors and omissions excepted.

The author and FXStreet are not registered investment advisors and nothing in this article is intended to be investment advice.

Recommended content


Recommended Content

Editors’ Picks

XRP gains as traders gear up for futures ETFs debut this week

XRP gains as traders gear up for futures ETFs debut this week

XRP climbs over 3% on Monday, hovering around $2.33 at the time of writing. The rally is likely catalyzed by key market movers like XRP futures Exchange Traded Funds (ETFs) approval by the US financial regulator, the Securities and Exchange Commission (SEC), and a bullish outlook. 

Bitcoin Price Forecast: BTC eyes $97,000 as institutional inflow surges $3.06 billion in a week

Bitcoin Price Forecast: BTC eyes $97,000 as institutional inflow surges $3.06 billion in a week

Bitcoin (BTC) price is stabilizing above $94,000 at the time of writing on Monday, following a 10% rally the previous week. The institutional demand supports a bullish thesis, as US spot Exchange Traded Funds (ETFs) recorded a total inflow of $3.06 billion last week, the highest weekly figure since mid-November.

Ethereum Price Forecast: ETH ETFs post first weekly inflows since February

Ethereum Price Forecast: ETH ETFs post first weekly inflows since February

Ethereum (ETH) recovered the $1,800 price level on Saturday after US spot Ether ETFs (exchange-traded funds) recorded their first weekly inflows since February.

Defi Development Corporation files to offer $1 billion in securities to boost its Solana holdings

Defi Development Corporation files to offer $1 billion in securities to boost its Solana holdings

Defi Development Corporation (formerly Janover) filed a registration statement with the Securities & Exchange Commission (SEC) on Friday, signaling its intent to offer and sell a wide range of securities, including common and preferred stock, debt instruments and warrants for the purchase of equity

Bitcoin Weekly Forecast: BTC consolidates after posting over 10% weekly surge 

Bitcoin Weekly Forecast: BTC consolidates after posting over 10% weekly surge 

Bitcoin (BTC) price is consolidating around $94,000 at the time of writing on Friday, holding onto the recent 10% increase seen earlier this week.

Read full analysis
The Best brokers to trade EUR/USD

The Best brokers to trade EUR/USD

SPONSORED Discover the top brokers for trading EUR/USD in 2025. Our list features brokers with competitive spreads, fast execution, and powerful platforms. Whether you're a beginner or an expert, find the right partner to navigate the dynamic Forex market.

Read More

BTC

ETH

XRP