Fartcoin, SPX6900 Price Prediction: Meme coins eye further gains amid record-high Open Interests
- Fartcoin loses steam as it nears a crucial resistance level at $1.56 that has remained intact since late January.
- SPX6900 edges lower after a 12% surge on Wednesday, with bulls aiming to surpass the $1.80 level.
- The Open Interest of FARTCOIN and SPX crossed $1 billion and $200 million, respectively, signaling increased interest from traders.

The Solana-based meme coin market capitalization has jumped 6% over the last 24 hours, reaching $14.64 billion, leading the broader cryptocurrency market's recovery. Fartcoin (FARTCOIN) and SPX6900 (SPX), which edged lower after double-digit gains on Wednesday, are among the top performers. Both the derivative data and technical outlook indicate a bullish bias as open interest reaches record high levels and trend momentum increases.
Fartcoin Open Interest hits $1 billion, SPX OI crosses $200 million
Open Interest (OI) refers to the total value of open perpetual derivative contracts, serving as a direct indicator of traders’ interest.
CoinGlass’ data shows that the Fartcoin Open Interest reached a new all-time high of $1.05 billion, up from $802.60 million on Wednesday. The SPX OI also hits a record high of $200 million.
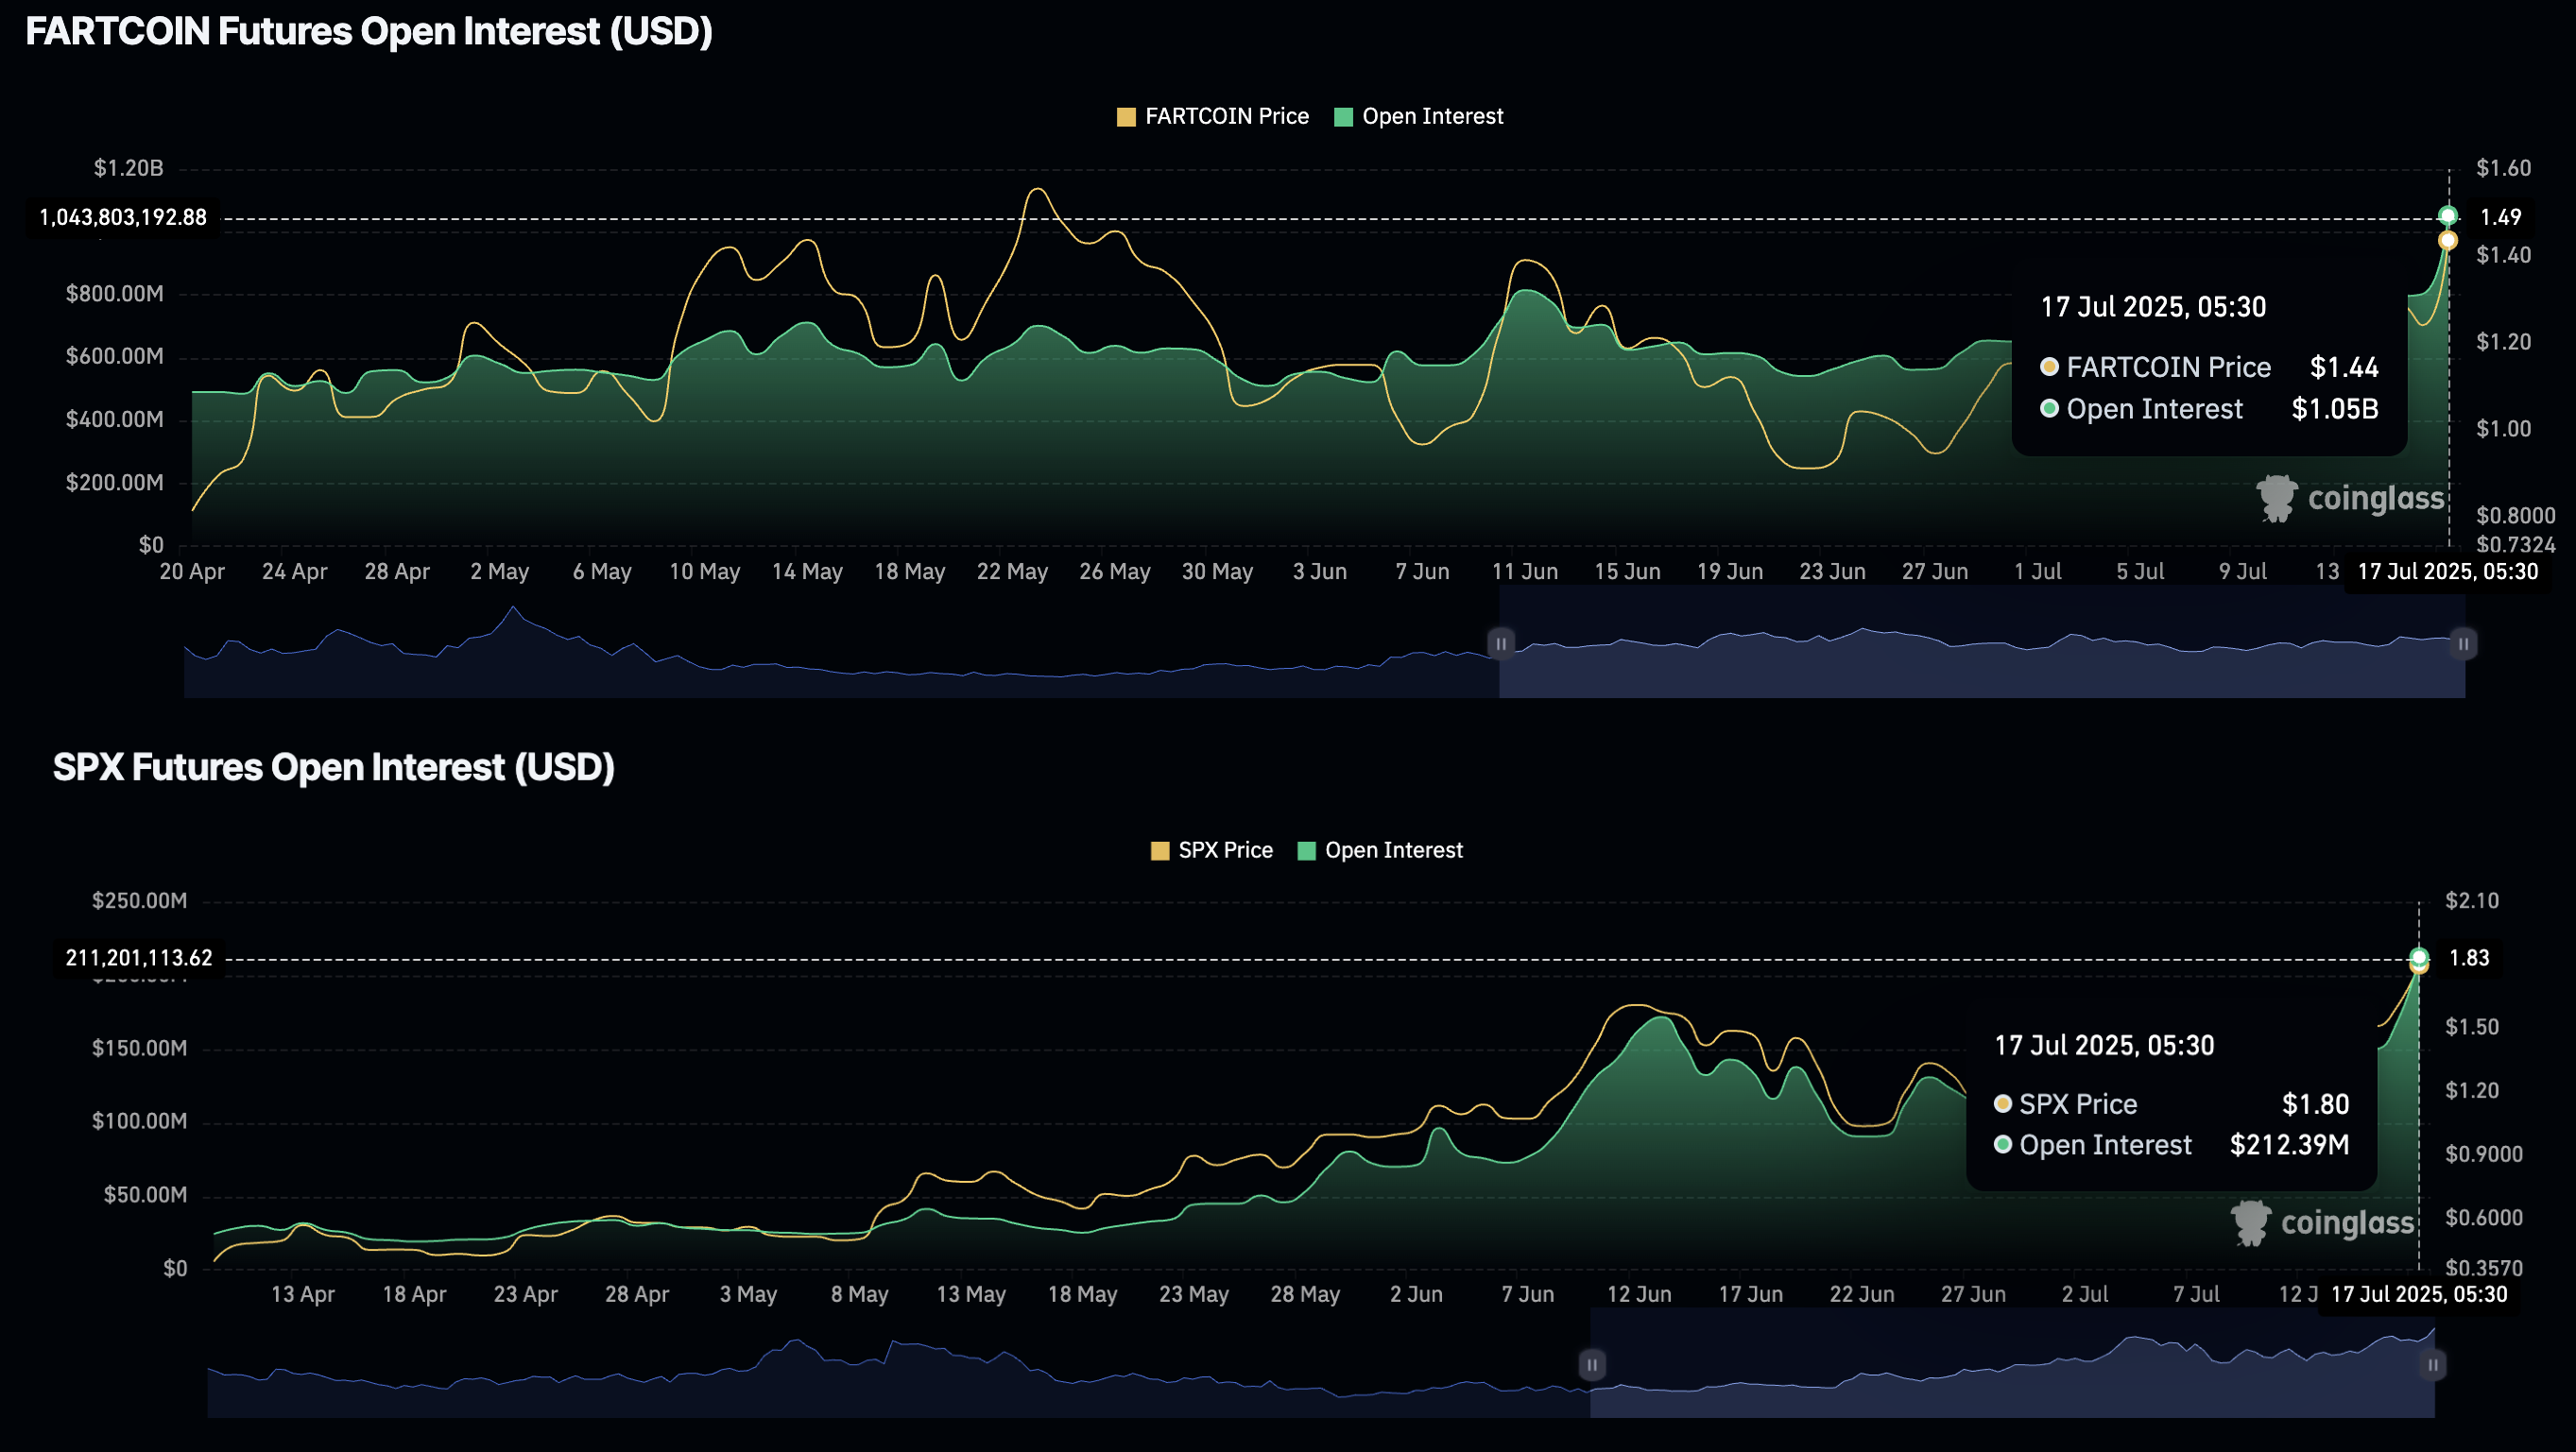
Open Interest. Source: Coinglass
The increasing OI suggests a boost in traders’ interest as the meme coins scale to new swing highs.
FARTCOIN, SPX eye further gains amid increasing bullish momentum
Fartcoin edges lower by 5% at press time on Thursday following a 16% surge on the previous day. The meme coin holds dominion over the 50-day Exponential Moving Average (EMA) and the $1 psychological level.
Fartcoin nears the 78.6% Fibonacci retracement level at $1.56, drawn from the $2.74 peak of January 19 to the low of $0.19 from March 10. A potential daily close above this level could extend the bullish run to the $2.00 round figure.
The Moving Average Convergence/Divergence (MACD) indicator shows a positive trend in MACD and its signal line. Still, the fluctuating green histogram bars suggest increased volatility in trend momentum.
The Relative Strength Index (RSI) stands at 59, indicating a gradual increase in bullish momentum as it surpasses the midpoint. The RSI indicates room for growth before reaching overbought conditions.
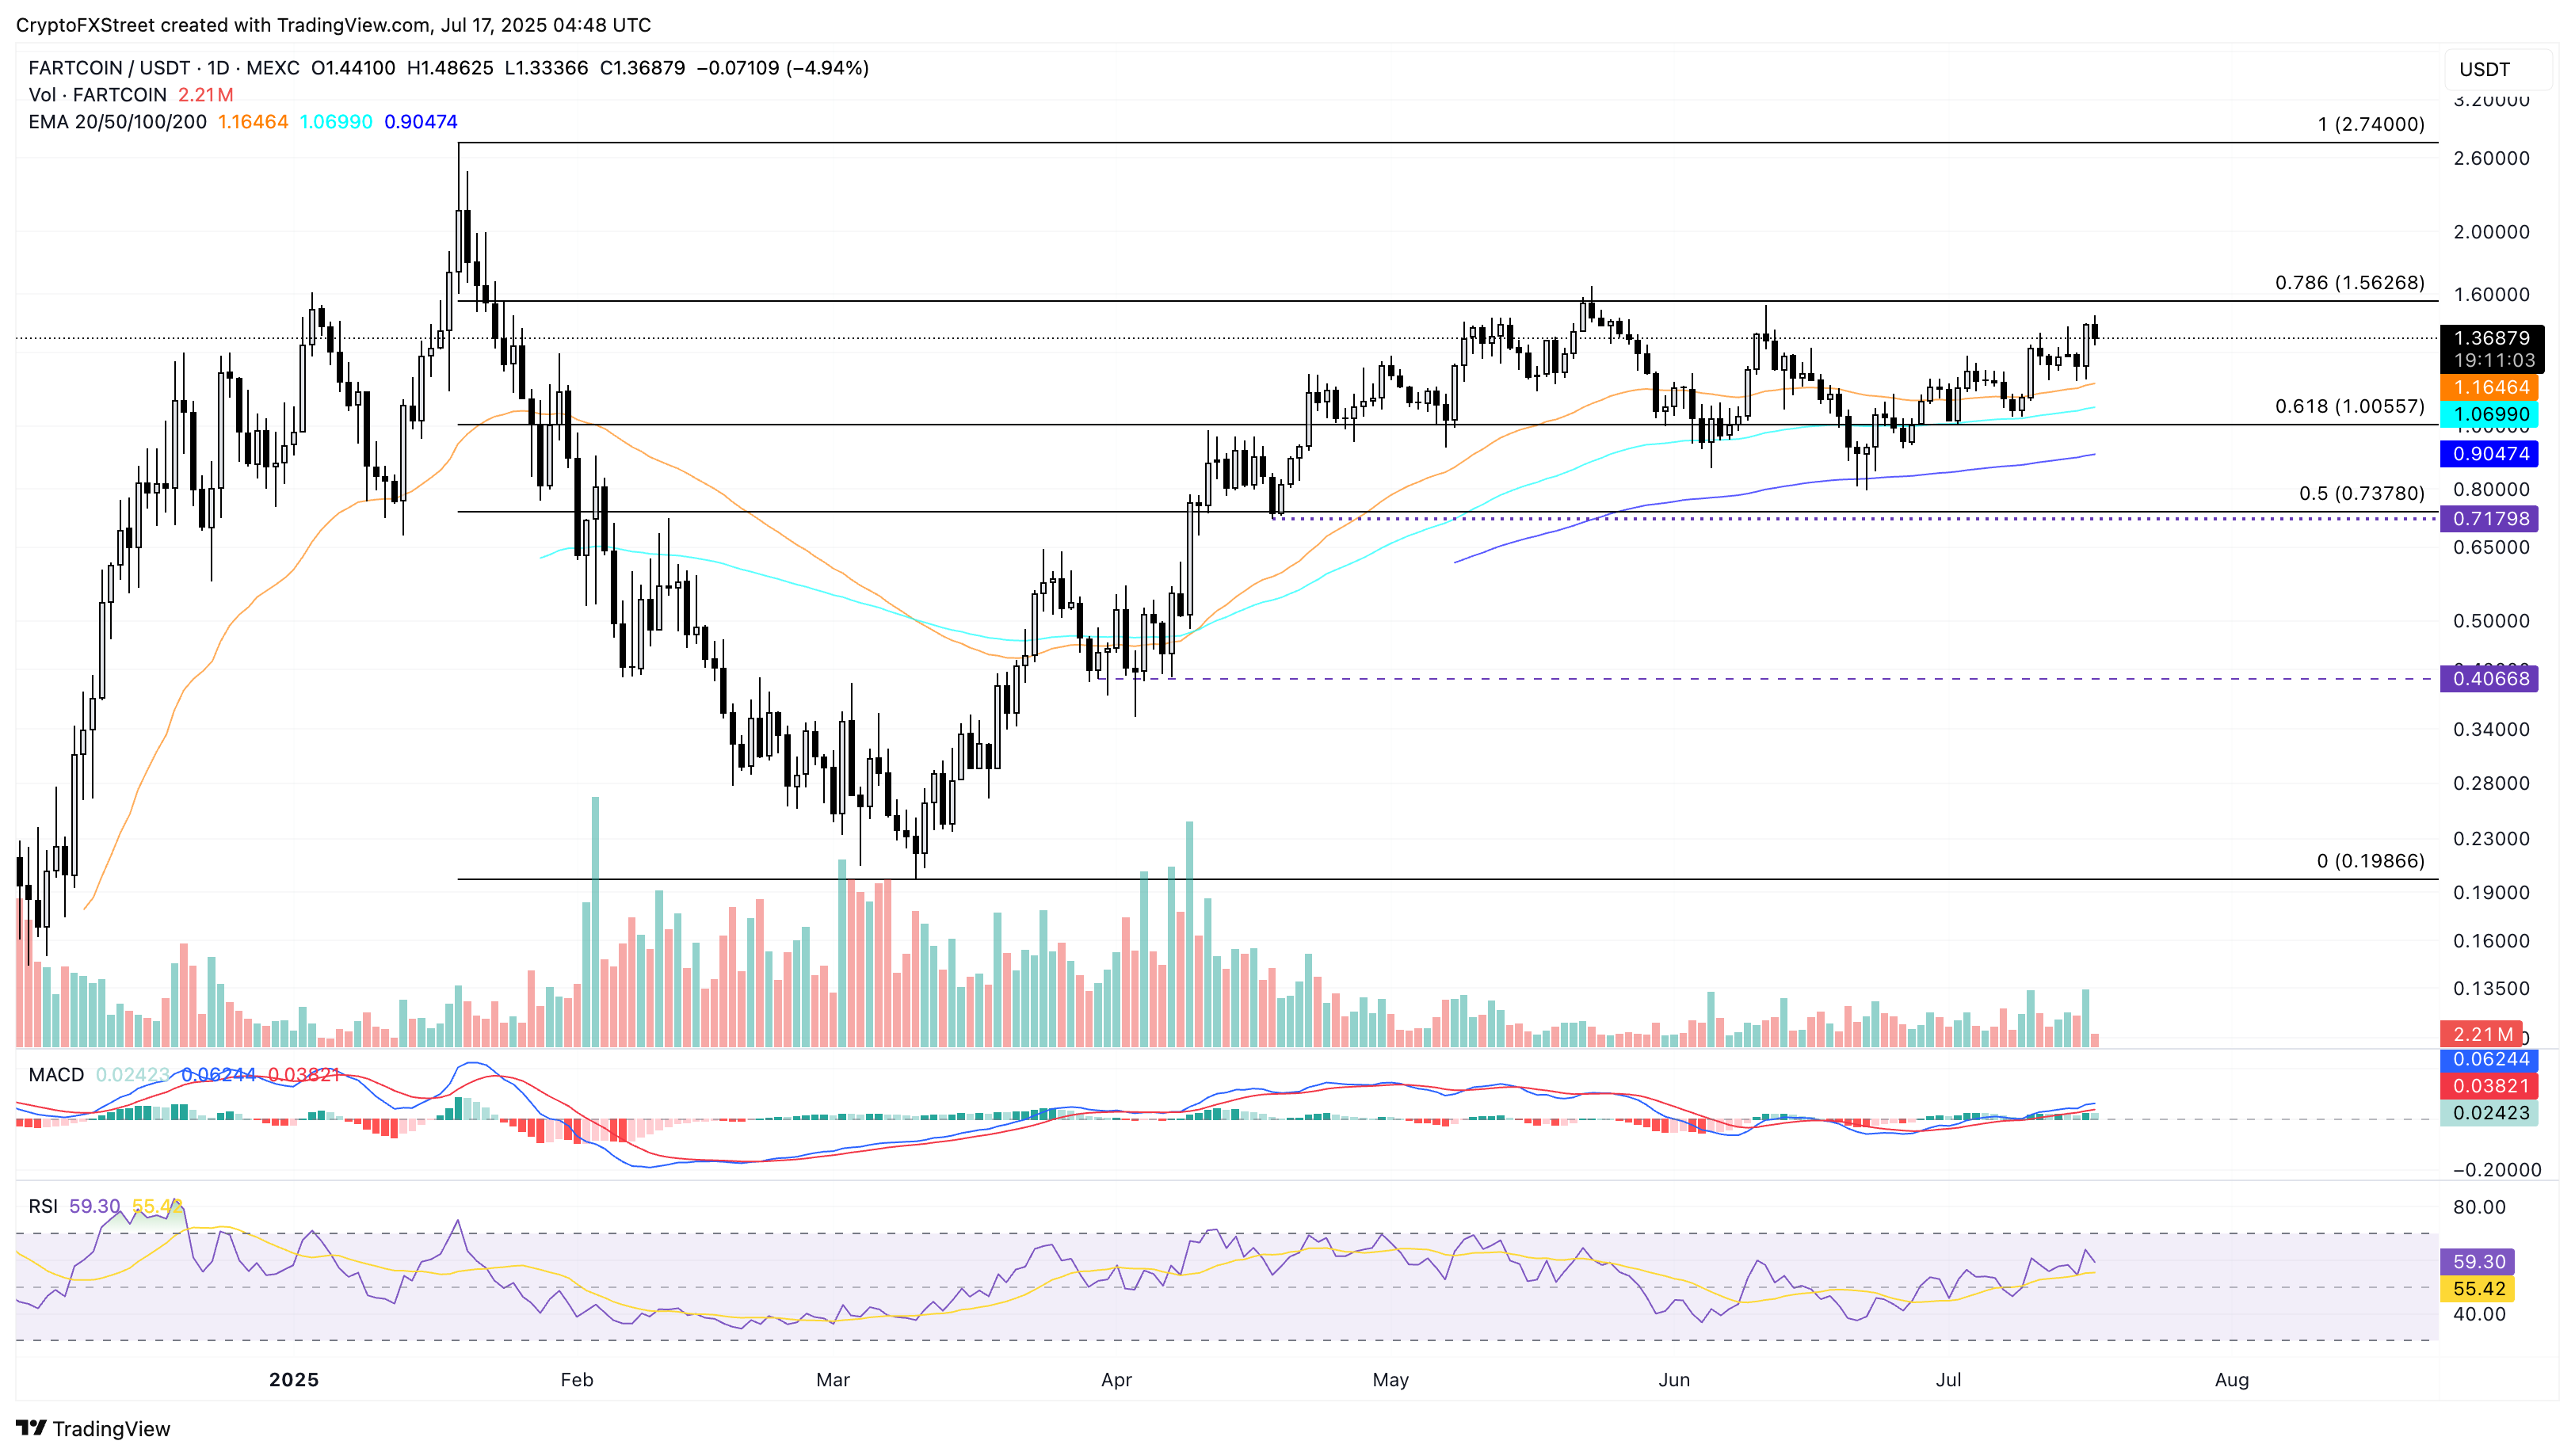
FARTCOIN/USDT daily price chart.
On the other hand, a reversal from the $1.56 resistance, which has remained intact since January 19, could test the 50-day EMA at $1.16.
SPX edges lower by nearly 1% so far on Thursday after reaching a new all-time high of $1.91 with a 12% jump on Wednesday. The meme coin struggles to manage a daily close above the $1.80 level, aligning with the previous all-time high.
A decisive push above $1.80 could stretch the uptrend to the $2.00 round figure, followed by the 1.272 Fibonacci level at $2.22, retraced from the $1.80 high of January 19 to the March 11 low of $0.25.
The momentum indicator maintains a bullish bias, similar to Fartcoin, with the RSI crossing above the halfway line to 67. Meanwhile, the MACD provides a mixed signal, characterized by fluctuating green histogram bars.
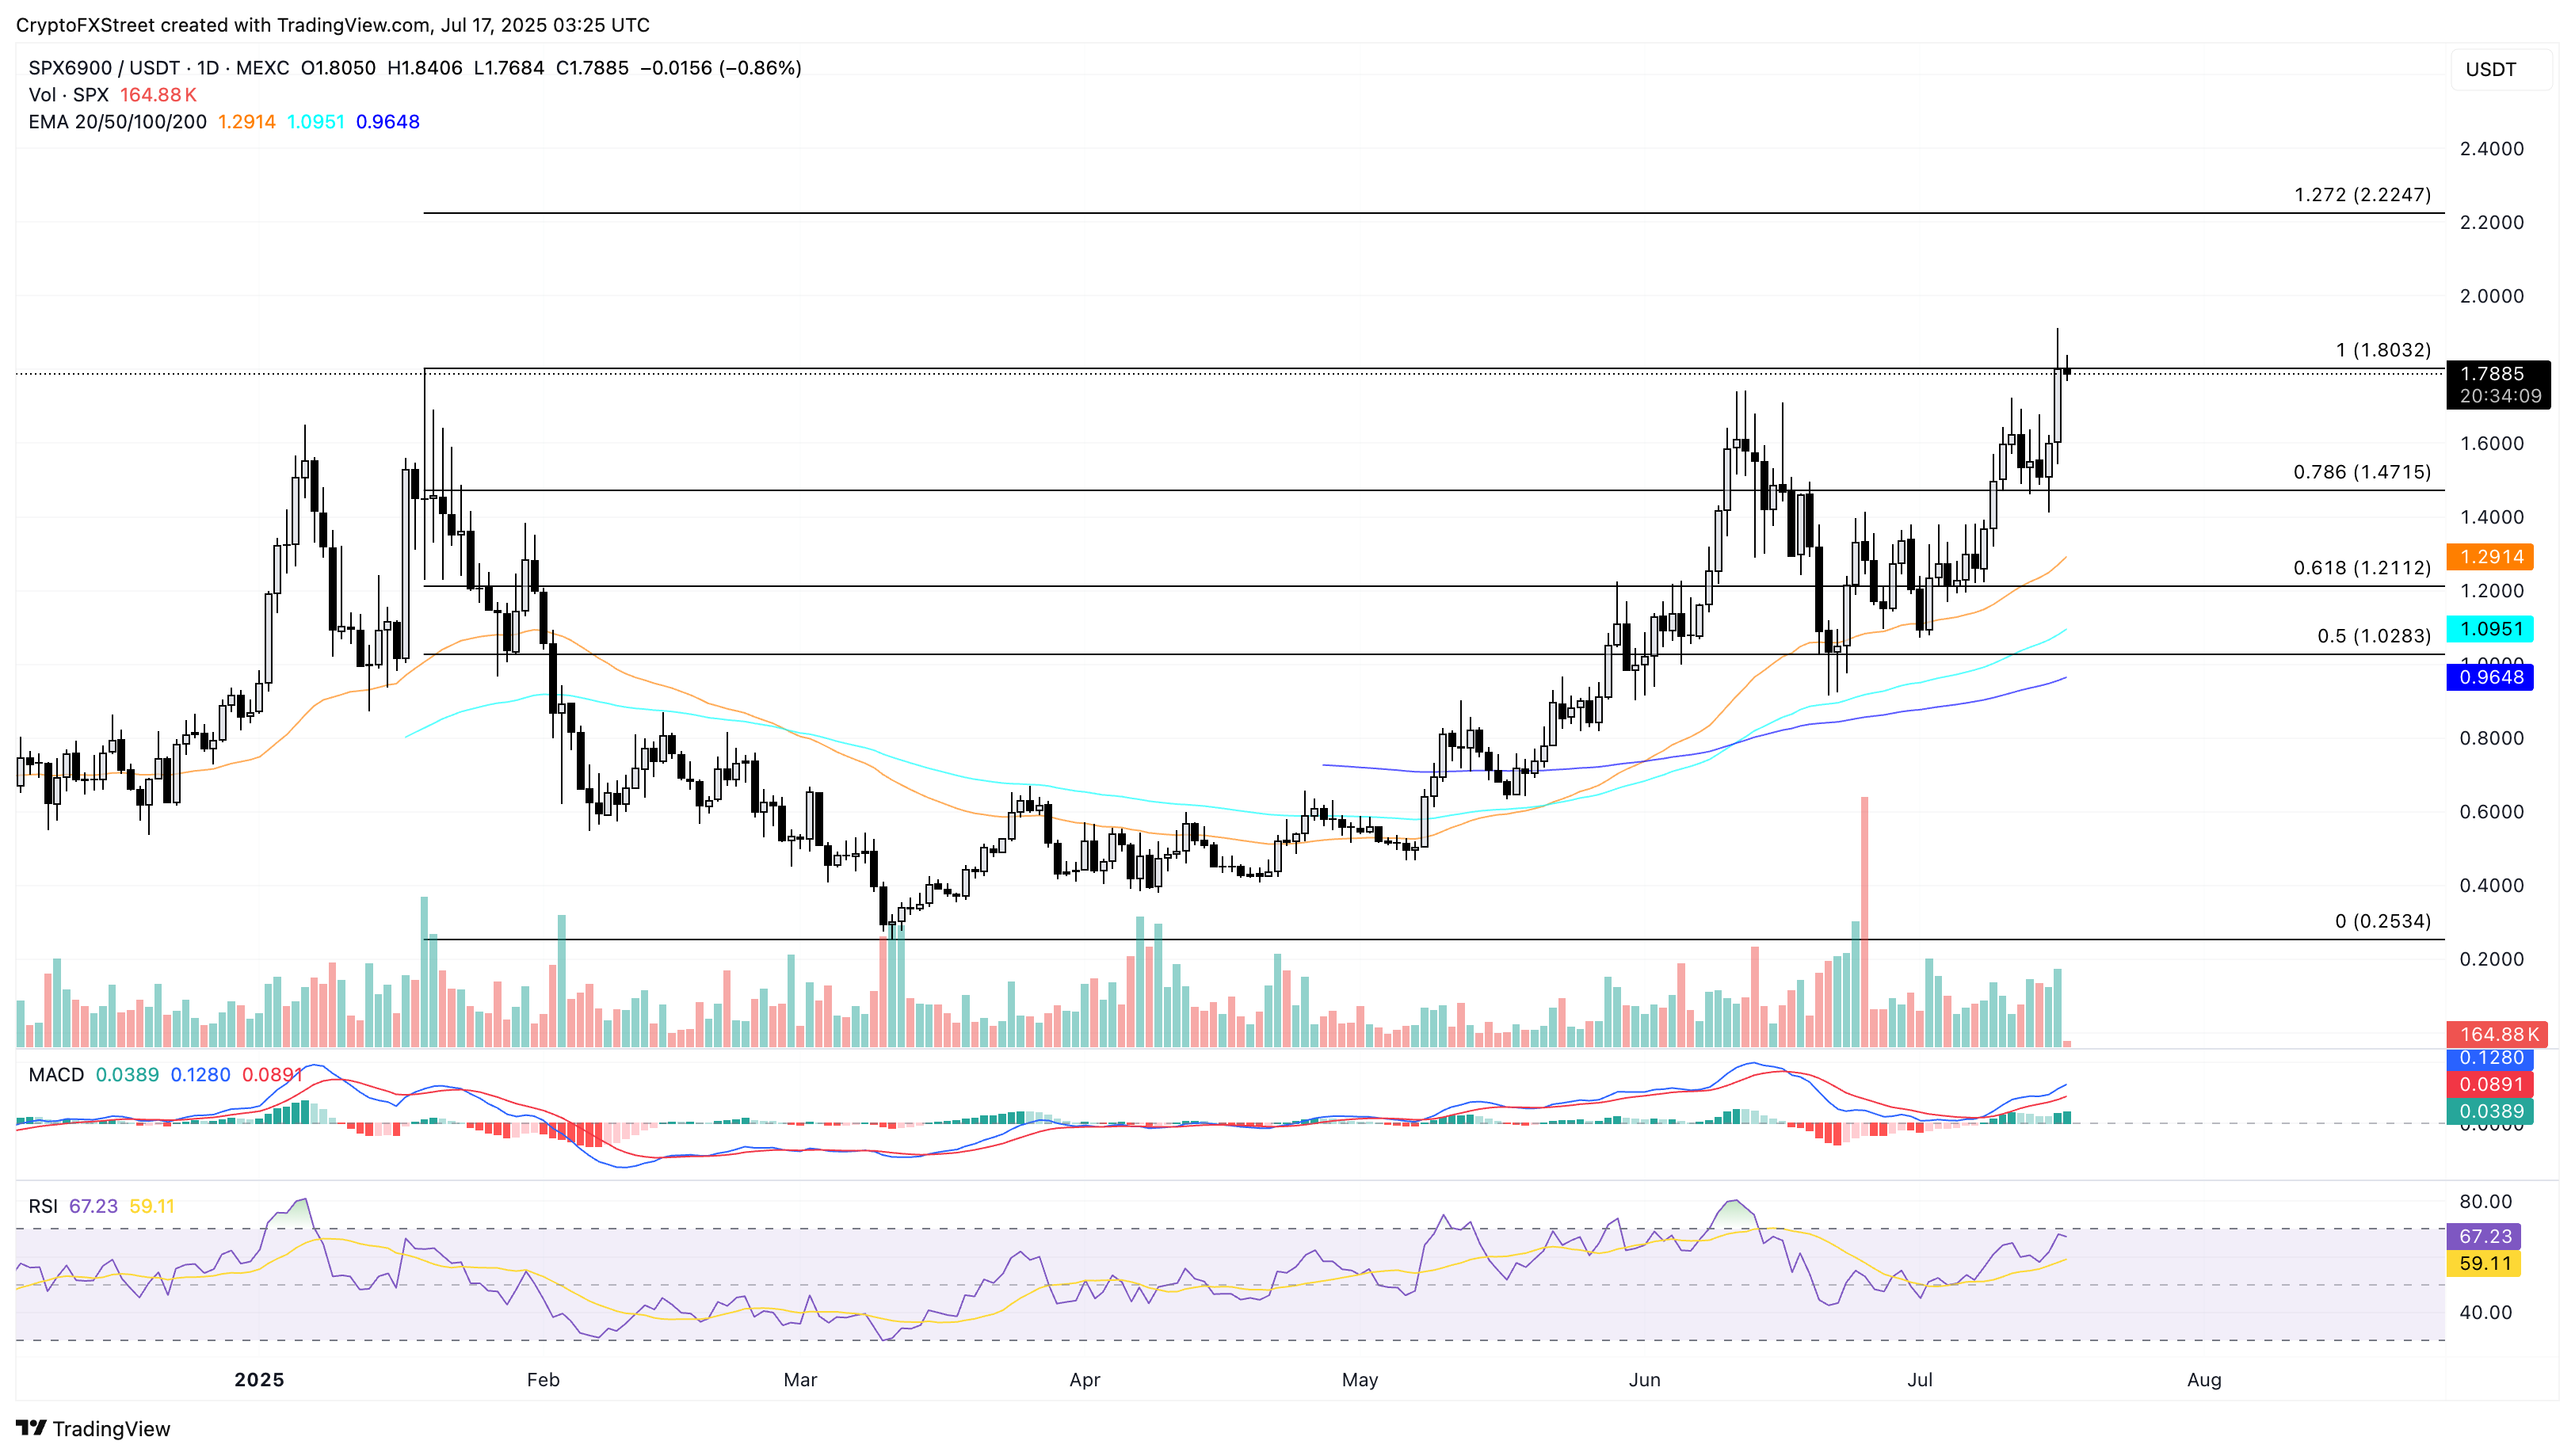
SPX/USDT daily price chart.
On the other hand, a reversal in the SPX from the $1.80 resistance could test the 78.6% Fibonacci retracement level at $1.47.
Author

Vishal Dixit
FXStreet
Vishal Dixit holds a B.Sc. in Chemistry from Wilson College but found his true calling in the world of crypto.


