ETH/USD is bearish – Elliott Wave analysis

Hello traders,
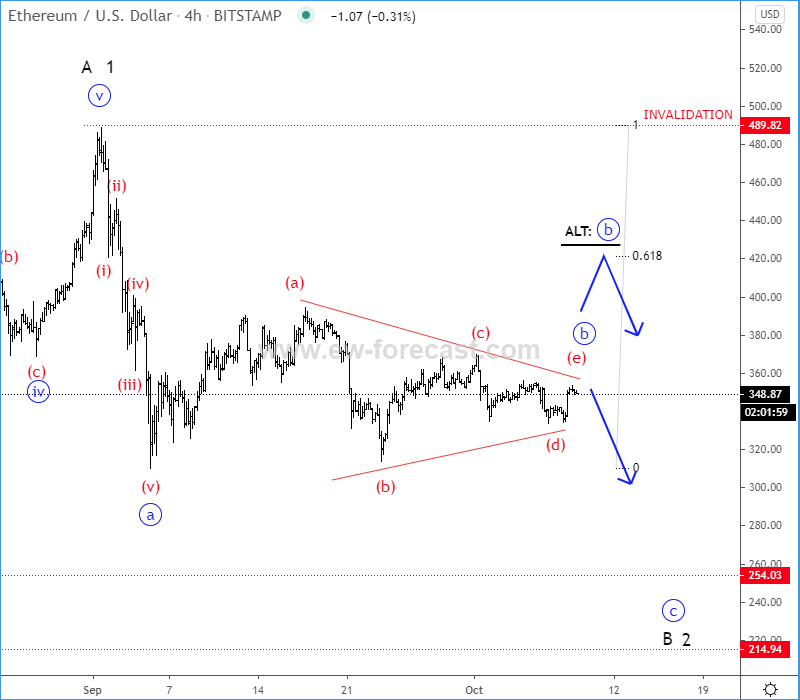
ETHUSD unfolded a five-wave move from the 490 level in wave a, and started trading choppy, sideways and overlapping, ideally unfolding a triangle correction in wave b, which is now coming to an end. We can see all five needed sub-wave in a triangle: a-b-c-d and now e, so be aware of a possible turn into a wave c at the upper triangle line (350/360 region). Once we see an impulsive break below the lower triangle line, that is when wave c lower can be underway.
If wave b starts forming another complex pattern, then be aware of a possible rally towards the Fib. ratio of 0.618 (415/420 area), before a reversal.
ETH/USD, 4h
Interested in our services? We have 50% OFF on Forex and the Crypto market
Author

Gregor Horvat
Wavetraders
Experience Grega is based in Slovenia and has been in the Forex market since 2003.


