Ethereum testing 23.6% and 38.2% Fibonacci support of wave 4

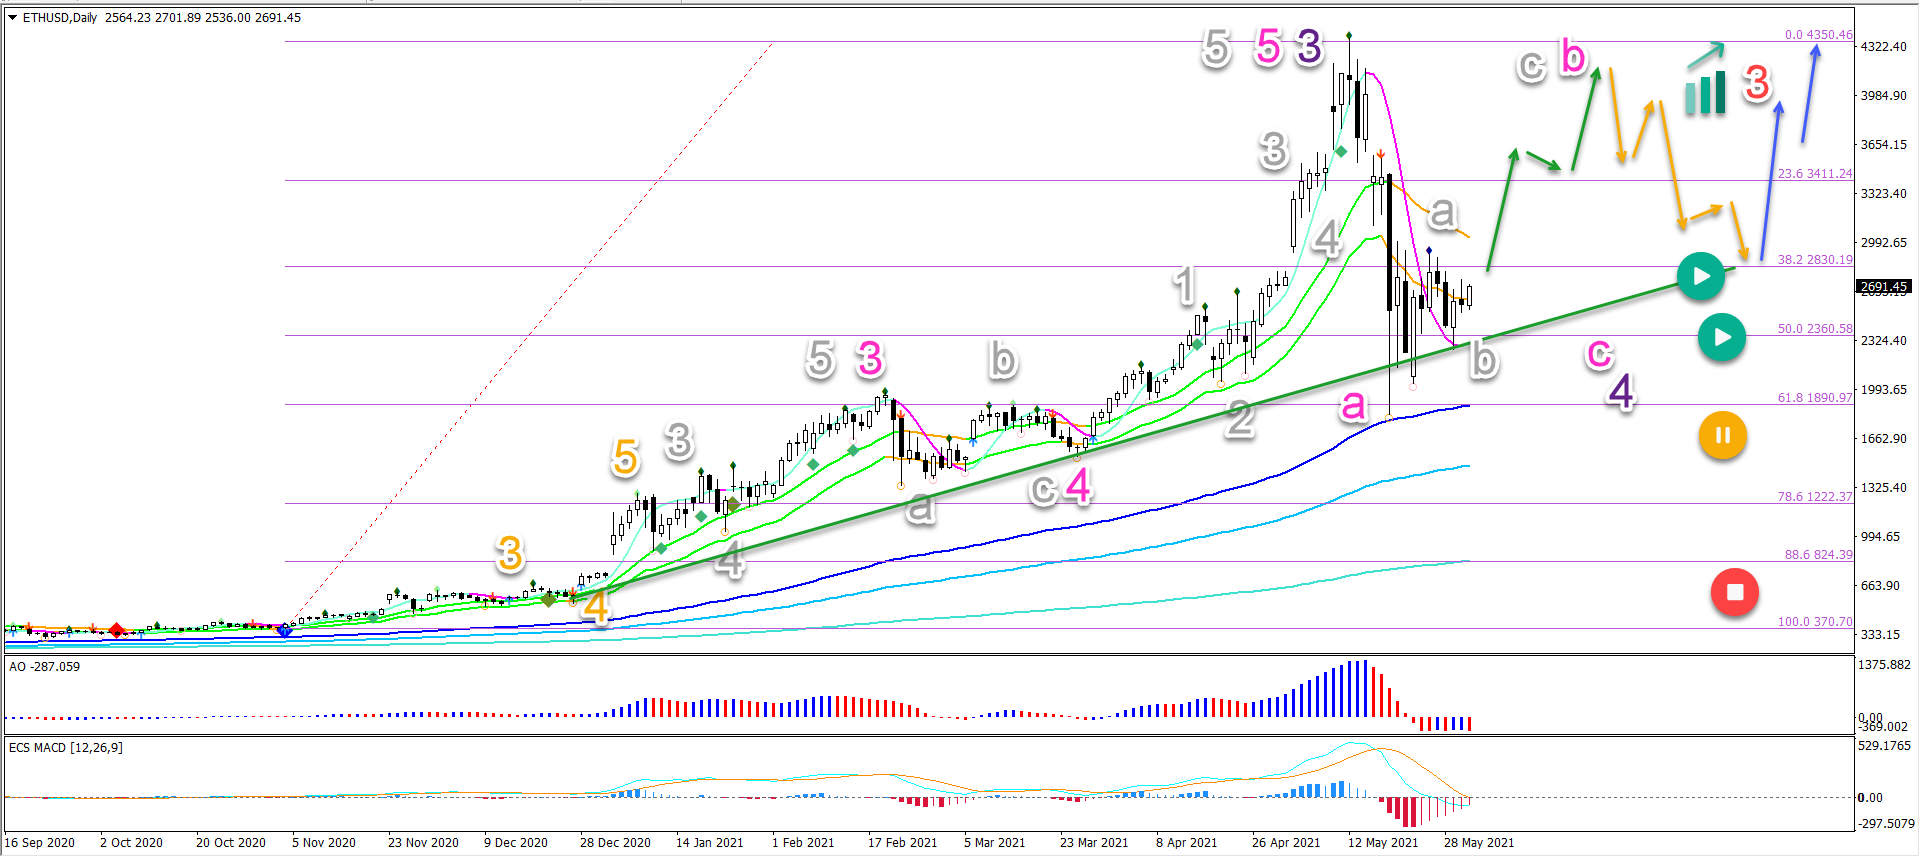
Ethereum (ETH/USD) is showing strong bullish momentum as mentioned last time. The angle of the uptrend has only accelerated recently (blue arrows).
However, yesterday’s daily candlestick closed as a Doji which indicates indecision. Is this a first sign of a reversal? Let’s review.
Price charts and technical analysis
The ETH/USD uptrend seems too strong for a reversal to take place now:
-
The gaps between the moving averages (MAs), the angle of the MAs, and the gap between price and the 21 EMAs all indicate a strong uptrend.
-
The Doji daily candlestick indicates indecision and it is more likely to create a potential sideways pullback (grey arrow) or retracement (orange arrow) in the uptrend.
-
The support zone (blue box) is likely a bouncing spot (blue box) for more upside (green arrows).
-
Only a deeper retracement places the bullish outlook on hold (orange) or invalidates it (red circle).
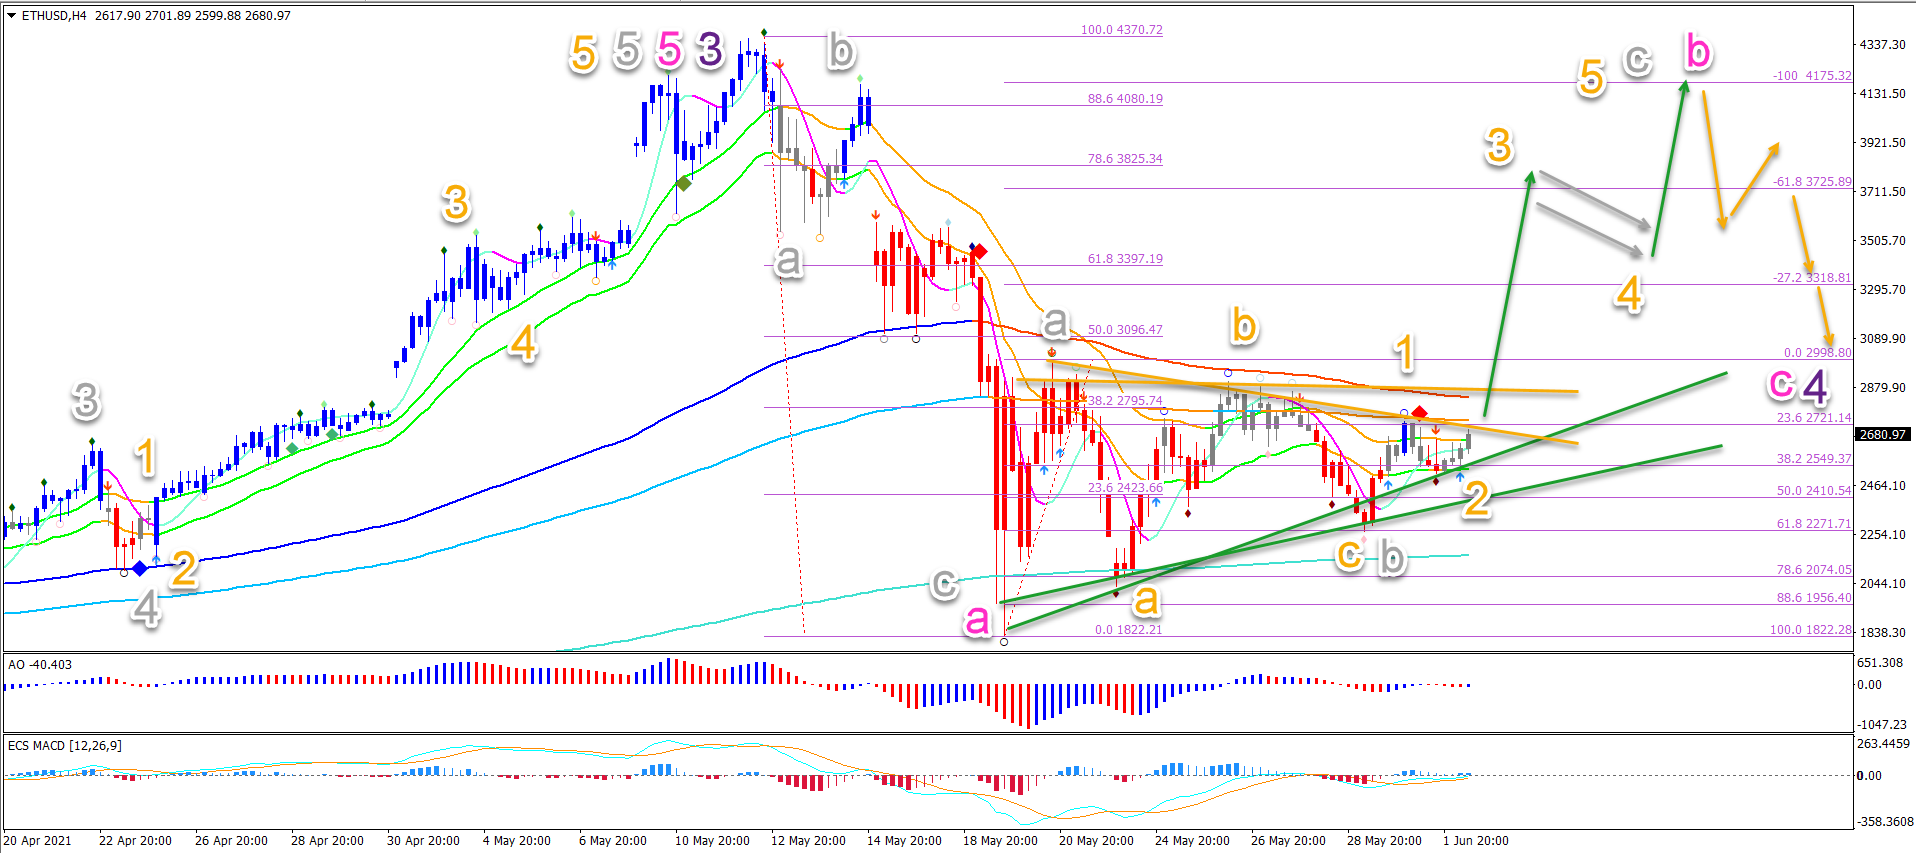
On the 4 hour chart, price action made a bearish pullback to and bounce at the 23.6% Fibonacci retracement level:
-
After completing a 5 wave pattern (blue) in wave 3 (orange), price action is probably building a wave 4 pullback (orange).
-
The 23.6% and 38.2% Fibonacci retracement levels remain key for the potential wave 4 (orange) pattern.
-
A bull flag pattern (grey arrows) could indicate a shallow pullback and uptrend continuation (blue arrow).
-
A deeper pullback (orange arrows) will probably test the Fibonacci support levels.
-
The targets of the uptrend are located at $4750, $5000, $5500.
-
A break below the 50% Fib places the uptrend on hold (yellow button) whereas a deeper retracement invalidates it (red button).
The analysis has been done with the ecs.SWAT method and ebook.
Author

Chris Svorcik
FS method
Chris Svorcik is a trader, analyst, and educator with over 15 years of experience in financial markets, specializing in moving averages, market structure, and price patterns.


