Ethereum technical analysis: Ethereum technical analysis: ETH/USD big barrier from $180-200 is a problem
- Ethereum price is trading in the red, up 1.50% the session on Tuesday.
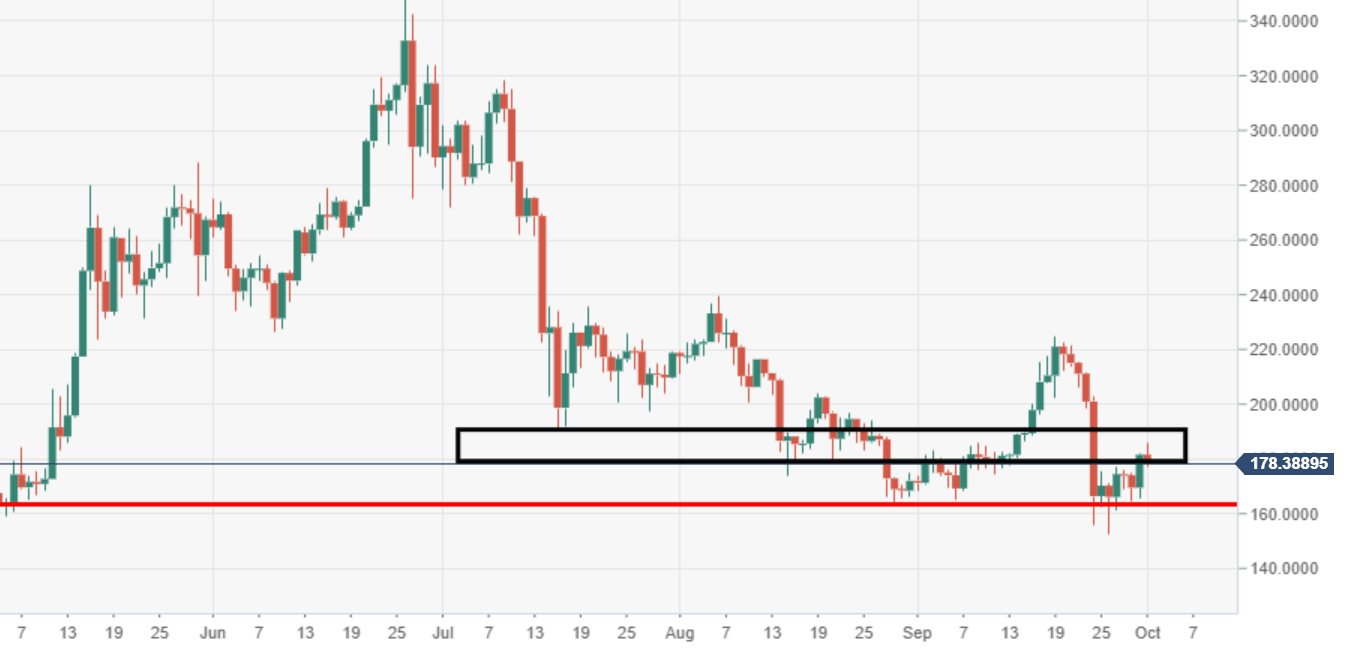
- ETH/USD price action is largely capped to the upside by daily supply zone, $180-200.
- The rally of Monday is being sold by the bears, upside proving to be unsustainable across the market.

ETH/USD daily chart
Price action is limited to the upside, the bulls continue to have problems with supply heading into the psychological $200 mark.
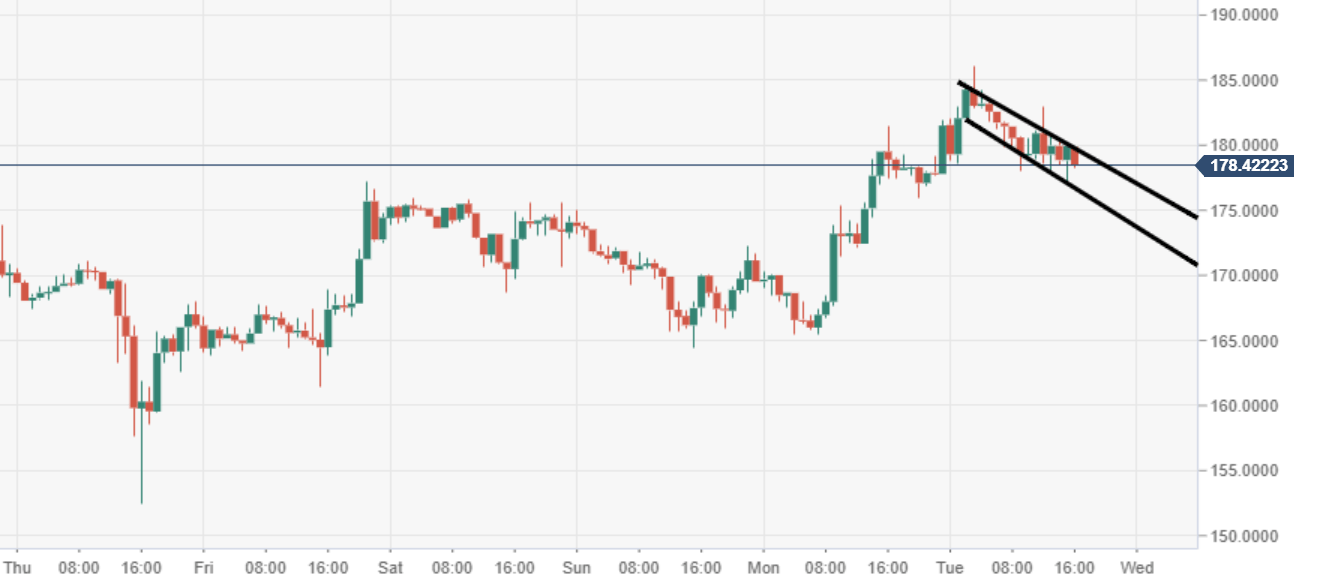
ETH/USD 60-minute chart
A bullish flag structure can be observed via the 60-minute chart view, subject to a potential breakout higher.
Spot rate: 179.15
Relative change: -1.50%
High: 186.06
Low: 176.96
Author

Ken Chigbo
Independent Analyst
Ken has over 8 years exposure to the financial markets. He started his career as an analyst, covering a variety of asset classes; forex, fixed income, commodities and equities.
More from Ken Chigbo


