Ethereum Technical Analysis: ETH/USD price action narrows within early $500 territory, eyes on bearish flag formation
- Ethereum remains on the back foot during trading through Tuesday’s session, down 1.30%.
- A bearish flag formation can be eyed on the 15-minute chart view.
- ETH/USD price has been trading within a tight $30 range, over the past two sessions.

ETH/USD 15-minute chart
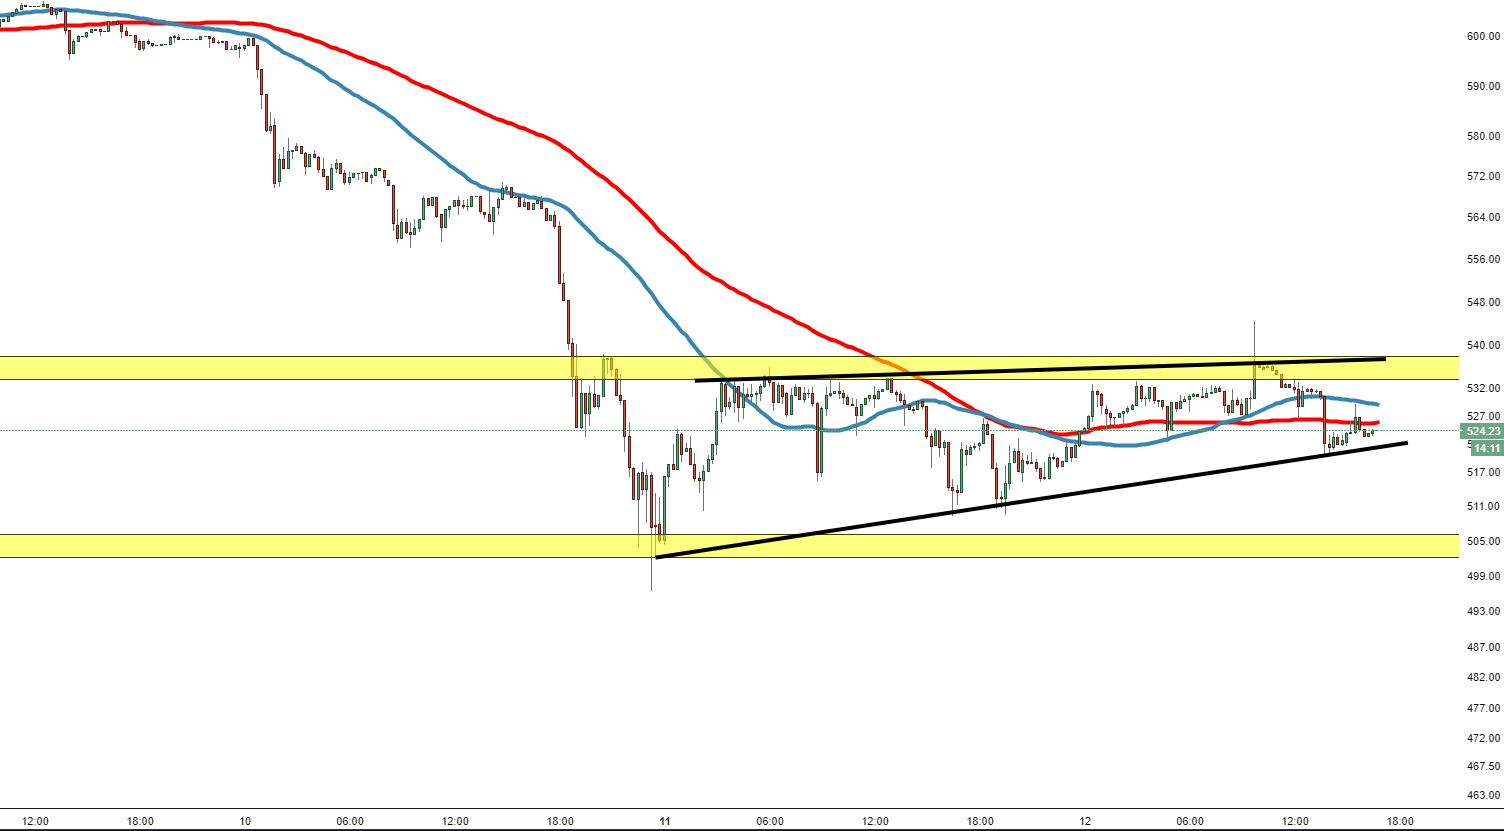
Spot rate: 523.71
Relative change: - 1.33%
High: 544.25
Low: 519.54
Trend: Bearish
Support 1: 520.00, lower trend line of flag.
Support 2: 509.30, (support on 15-minute chart)
Support 3: 505, demand zone entry.
Resistance 1: 525.60, 100MA.
Resistance 2: 529.05, 50MA.
Resistance 3: 533.50, entry supply zone.
Author

Ken Chigbo
Independent Analyst
Ken has over 8 years exposure to the financial markets. He started his career as an analyst, covering a variety of asset classes; forex, fixed income, commodities and equities.
More from Ken Chigbo


