Ethereum Technical Analysis: ETH/USD price action forms further trouble, as what looks to be another bearish pennant taking shape
- Ethereum price was seen up some decent 2.5%, pullback coming into play after the heavy recent sell-off.
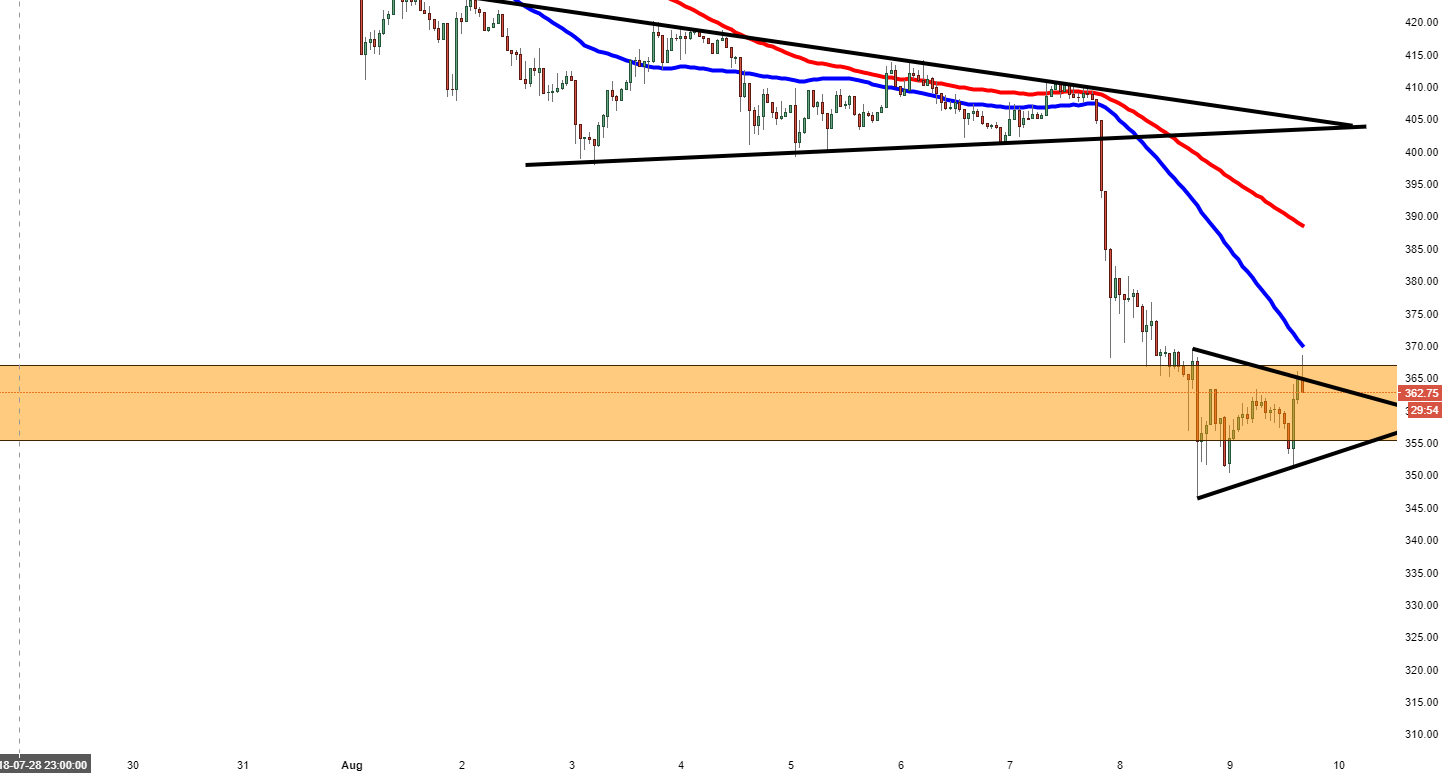
- ETH/USD recent upside may not be sustainable, given a bearish pennant pattern formation.

ETH/USD 60-minute chart
Spot rate: 363.23
Relative change: -2.5%
High: 368.37
Low: 350.83
Trend: Bearish
Support 1: 355.00, (support on 60-minute chart).
Support 2: 352.78, lower part of pennant pattern.
Support 3: 346.58, 8th August low.
Resistance 1: 365.05, upper part of pennant.
Resistance 2: 368.00, (resistance on 60-minute chart).
Resistance 3: 369.73, 50MA.
Author

Ken Chigbo
Independent Analyst
Ken has over 8 years exposure to the financial markets. He started his career as an analyst, covering a variety of asset classes; forex, fixed income, commodities and equities.
More from Ken Chigbo


