Ethereum technical analysis: ETH/USD downtrend targets $150
- Ethereum resumes the downtrend amidst broad-based declines in the cryptocurrency market.
- Ethereum's short-term technical picture remains positive despite the correction on Thursday.

Spot rate: $173.82
Relative change: -0.8456
Percentage change: -0.47%
Trend: Bullish
Volatility: Shrinking
ETH/USD daily chart
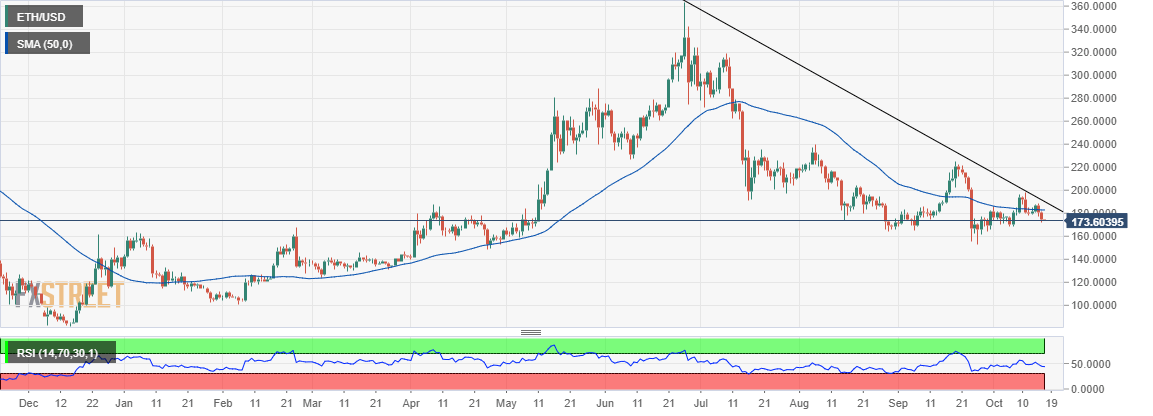
Ethereum corrects under the 50-day Simple Moving Average (SMA) as it approaches the critical support at $170.
The Relative Strength Index (RSI) downward slope signifies the strong bearish grip on the price.
ETH/USD 240’ chart
-637068839338637751.png)
For the first time in a week, Ethereum is grinding closer to the support at $170.
The Moving Average Convergence Divergence (MACD) sinks deeper in the negative region emphasizing the growing bearish momentum.
ETH/USD 60’ chart
-637068840146309893.png)
From a short-term perspective, Ethereum has the potential to force a reversal towards $180.
The MACD shows Ethereum having a short-term bullish bias but the bulls must make sure to defend the trendline support.
Author

John Isige
FXStreet
John Isige is a seasoned cryptocurrency journalist and markets analyst committed to delivering high-quality, actionable insights tailored to traders, investors, and crypto enthusiasts. He enjoys deep dives into emerging Web3 tren


