Ethereum technical analysis: ETH/USD consolidates in a flag formation as bulls and bears engage in an unenthusiastic back-and-forth
- ETH/USD went down from $184.50 to $182.10 this Monday.
- The SMA 50 curve has crossed over the SMA 20 curve in the hourly chart, which is a bearish sign.

ETH/USD daily chart
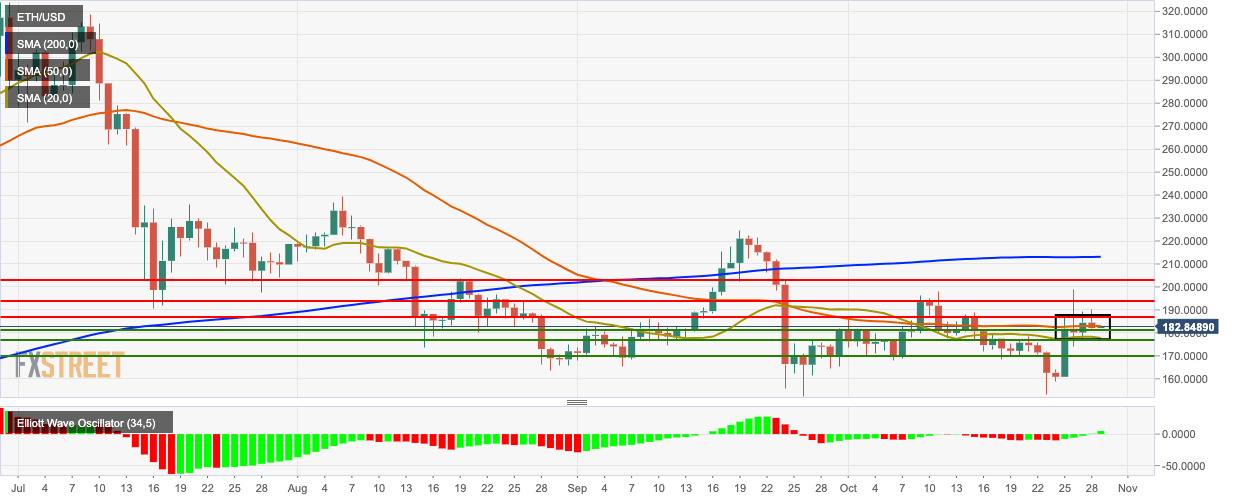
The daily ETH/USD is consolidating in a flag formation. This Monday price had gone up from $184.50 to $182.10. This Tuesday, the bears had taken control of the market and brought the price down to $182.75. The 50-day Simple Moving Average (SMA 50) curve acts as immediate market support.
ETH/USD four-hour chart
-637079086612872946.png)
The four-hour chart has spiked above the green Ichimoku cloud and is currently trending in a downward channel formation. The bulls must overcome resistance at the SMA 20 curve to continue the upward momentum. The Moving Average Convergence/Divergence (MACD) indicates bearish market momentum. The Bollinger width is trending at around 0.075, which shows decreasing market volatility.
ETH/USD hourly chart
-637079086204738179.png)
The SMA 50 has crossed over the SMA 20 curve, which is a bearish sign. Both of these curves are also acting as immediate market resistance. The 20-day Bollinger Band has gradually constricted, showing decreasing market volatility. The Relative Strength Index (RSI) indicator is trending around the neutral zone.
Key Levels
Author

Rajarshi Mitra
Independent Analyst
Rajarshi entered the blockchain space in 2016. He is a blockchain researcher who has worked for Blockgeeks and has done research work for several ICOs. He gets regularly invited to give talks on the blockchain technology and cryptocurrencies.


