Ethereum Technical Analysis: ETH/USD big near-term rejection, bulls fail to break through descending wedge
- Ethereum price was seen down on Tuesday 1.70%, after failing to break through descending wedge to the upside.
- ETH/USD rejection for bulls was seen at high of session $487.44, near-term support at $463.50, 50MA.

ETH/USD 60-minute chart
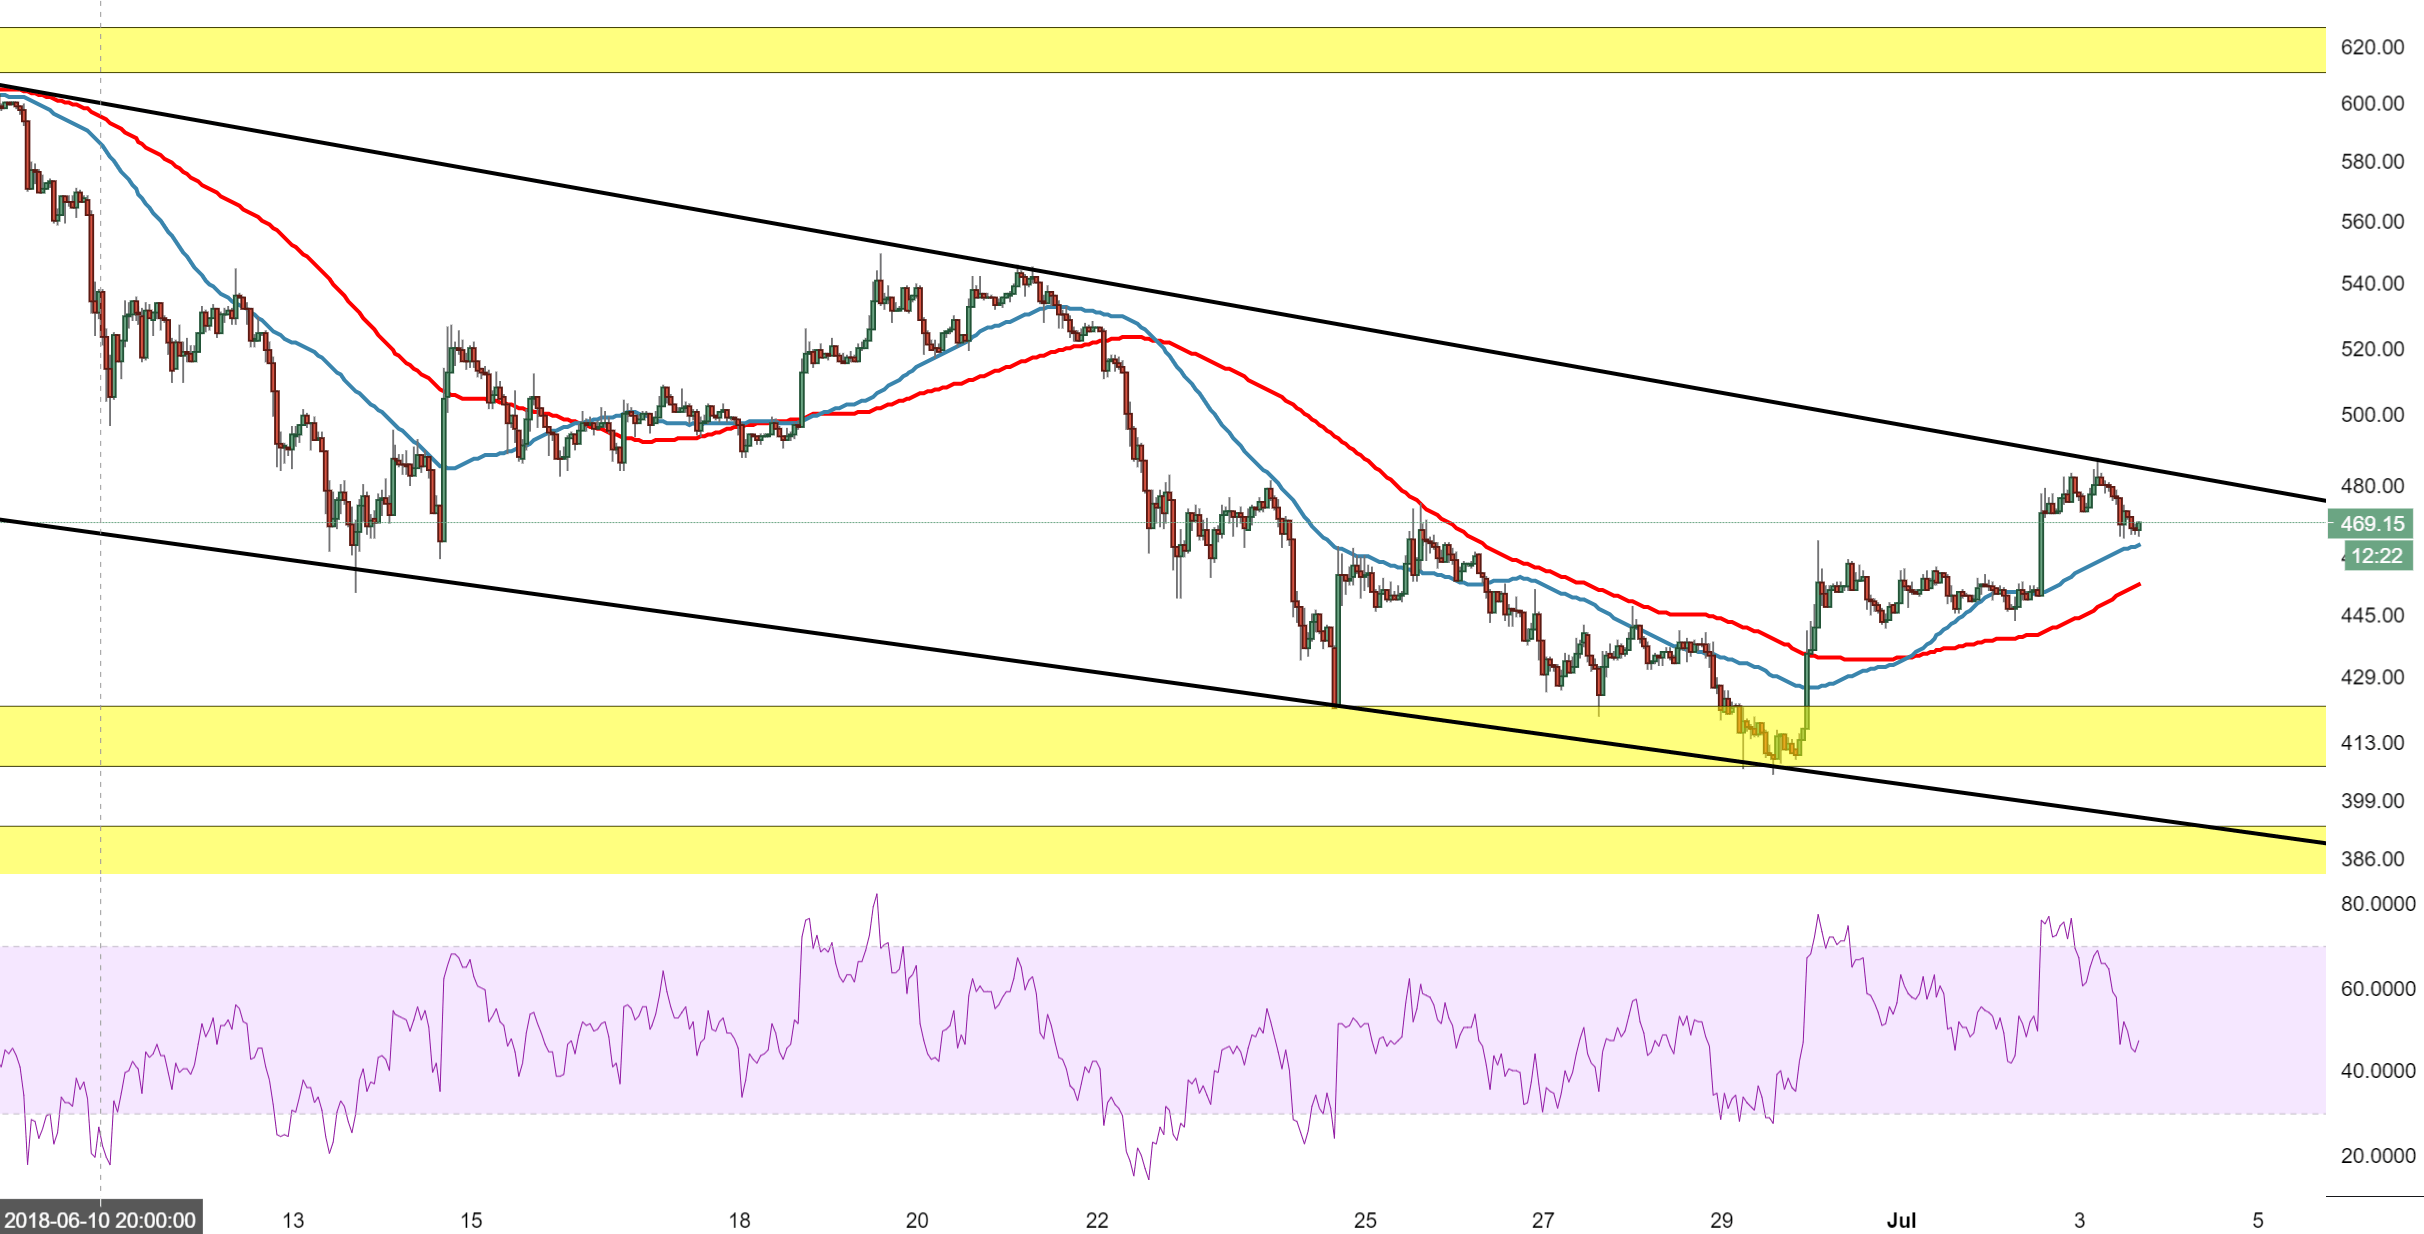
Spot rate: 468.59
Relative change: -1.70%
High: 487.44
Low: 464.62
Trend: Bearish
Support 1: 463.50, 50MA.
Support 2: 452.77, 100MA.
Support 3: 422.00, demand zone.
Resistance 1: 485.00, upper trend line of wedge.
Resistance 2: 500.00, psychological resistance.
Resistance 3: 525.60, (resistance on 60-minute chart).
Author

Ken Chigbo
Independent Analyst
Ken has over 8 years exposure to the financial markets. He started his career as an analyst, covering a variety of asset classes; forex, fixed income, commodities and equities.
More from Ken Chigbo


