Ethereum price builds on momentum as the much anticipated Berlin hard fork goes live
- Ethereum price trend creates significant opportunities for patient speculators.
- Berlin hard fork changes aim to bring gas fees in line with computation costs.
- Momentum indicators are not overbought, projecting higher prices.

Ethereum price over the last two days has shaken free of Bitcoin’s price stumbles and continued to rally to the first target of the 161.8% extension of the February decline at $2,504. This could potentially be followed by the symmetrical triangle measured move target of $2,507. Conditions remain in place for a continuation of the rally to the next levels of resistance, beginning at $3,250 and beyond.
Ethereum hard fork flaw leads Coinbase to disable ETH withdrawals temporarily
The second-largest cryptocurrency introduced a hard fork that seeks to solve a significant issue for the network, high gas fees. In a year, gas fees that users pay to use transactions have climbed from below 10 cents to a high of $40 in February. Currently, the average fee is close to $19, but in comparison to the minimal fees charged by Cardano and Algorand, the Ethereum costs are astronomical. Moreover, lesser-known networks such as Polygon and Celer Network have grown as they strive to combat the high gas fees by aggregating transactions.
Ethereum’s goal focuses on this hard fork changing the algorithm that calculates gas fees, with the hopes of appreciably reducing costs that may eventually stifle the amount of utility and transactions users ideally want to make. A chart of the gas fees since October 2020 is displayed below.
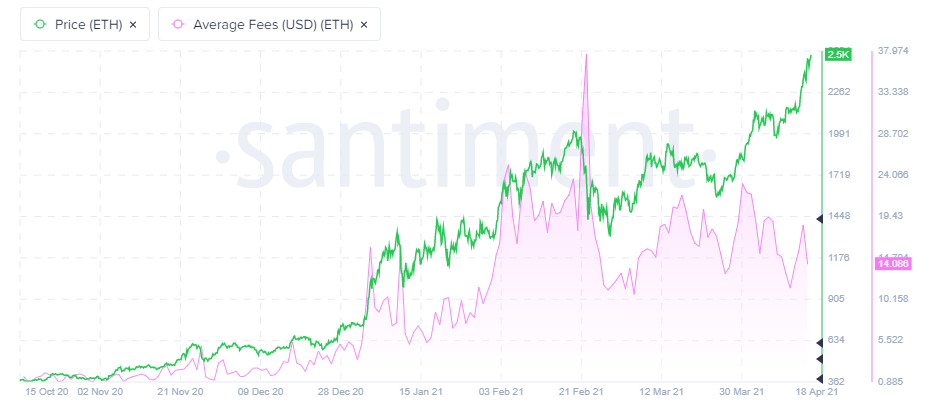
Source: Santiment
The hard fork is one of many improvements along the way to creating ETH 2.0, Ethereum’s transition from proof-of-work to proof-of-stake.
Ethereum price supported by more prominent investors gradually accepting the risk profile
The noteworthy advance since the late-March lows has not pushed the daily or weekly Relative Strength Indexes (RSI) into overbought conditions. There is no sign of a bearish momentum divergence, restoring confidence that strong tailwinds still support ETH.
In an FXStreet article on April 11, it was projected that ETH would challenge the 161.8% extension level of the February decline at $2,504 and reach the symmetrical triangle measured move target of $2,507 within a short time and that has been the case.
Due to the strength of the ETH rally and the recent decoupling from Bitcoin’s price stumbles, attention turns to higher price targets, including the 261.8% extension at $3,253. Patient speculators can hold out for the 261.8% extension of the 2018 bear market at $3,587.
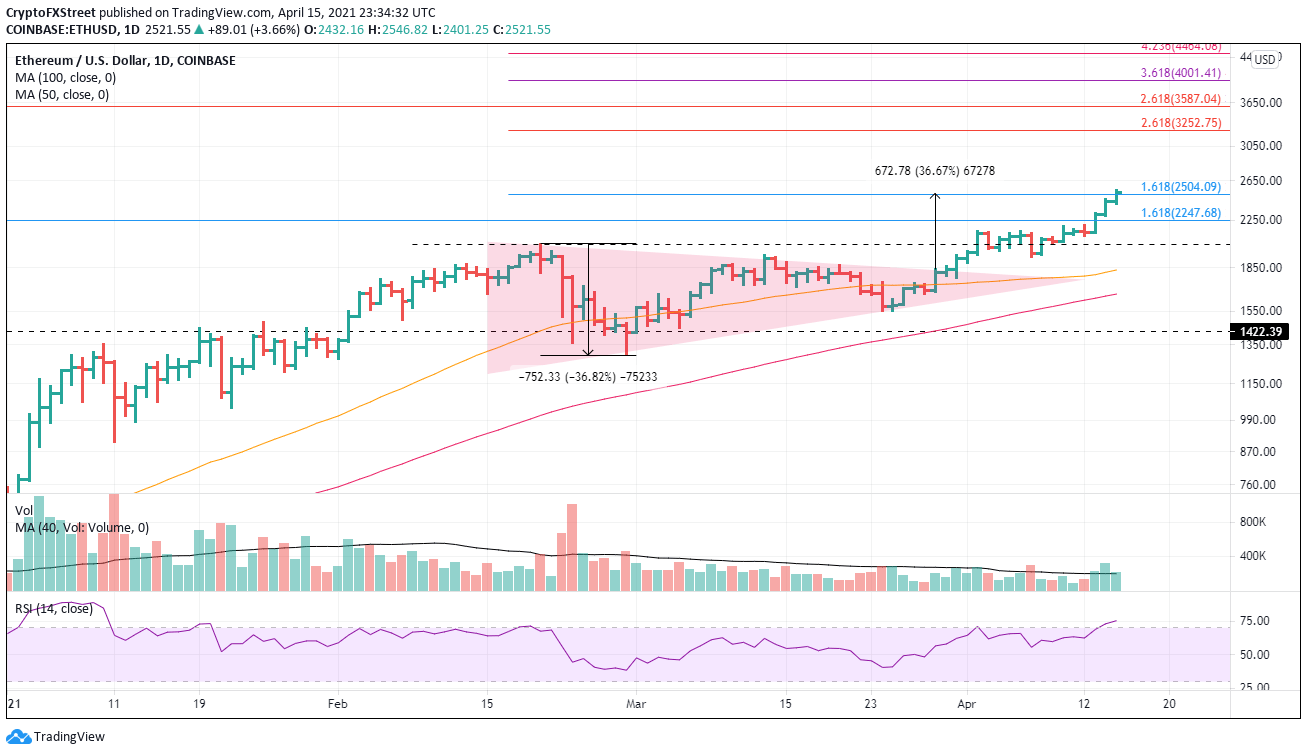
ETH/USD daily chart
A reversal of fortunes is always a possibility in investing, and ETH speculators should mark the early April highs as the first level of support if heavy selling emerges. The following support level is at the February high of $2,041. A failure there cancels the bullish outlook and puts price on course to test the 50-day simple moving average (SMA) at $1,835.
Author

Sheldon McIntyre, CMT
Independent Analyst
Sheldon has 24 years of investment experience holding various positions in companies based in the United States and Chile. His core competencies include BRIC and G-10 equity markets, swing and position trading and technical analysis.


